
The short-term technical outlook suggests that the asset continues to face downward momentum, with indicators pointing to an ongoing bearish phase unless buyers can reclaim key resistance levels.
In a recent update shared by Finora AI – Türkiye, the team noted that Optimism’s short-term market structure leans bearish as multiple indicators point downward. The analysis outlines that price action repeatedly failed to sustain movement above $0.4566–$0.4582, a well-defined supply zone that has triggered successive rejections.
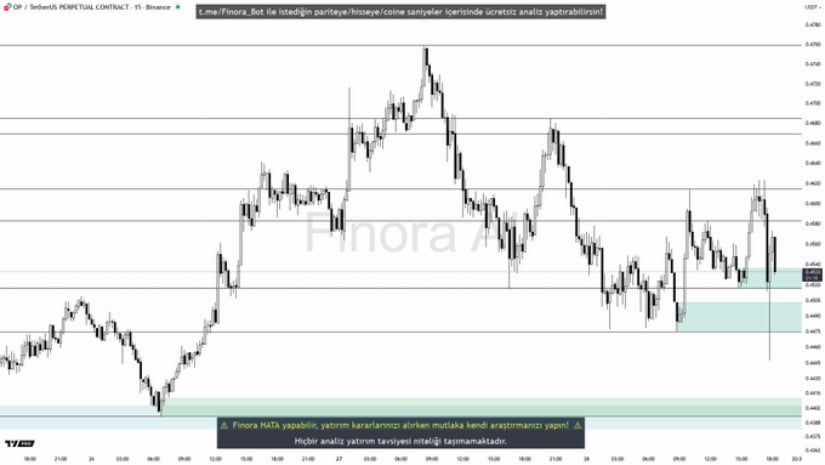
Source: Finora AI (X)
According to the automated projection, if the coin performs a fake breakout within this range followed by a bearish formation such as an engulfing candle, pin bar, or break of structure (BOS) on the lower timeframes, the setup may favor short-term short entries. The outlined targets are $0.4502, $0.4475, and $0.4444.
Conversely, Finora AI mentions that if price action sweeps liquidity below $0.4475 and exhibits a bullish response through a reversal pattern like Quasimodo or OTE retracement, a short-term long entry could be viable, targeting $0.4524 and $0.4566, respectively. The analysis highlights clear stop-loss levels above $0.4614 for shorts and below $0.4444 for longs.
Data from BraveNewCoin reveals that Optimism is trading at $0.44, down 3.95% over the last 24 hours. The network’s market capitalization stands at $827.74 million, ranking #124 globally, with a daily trading volume of $90.12 million and a circulating supply of 1.89 billion tokens.
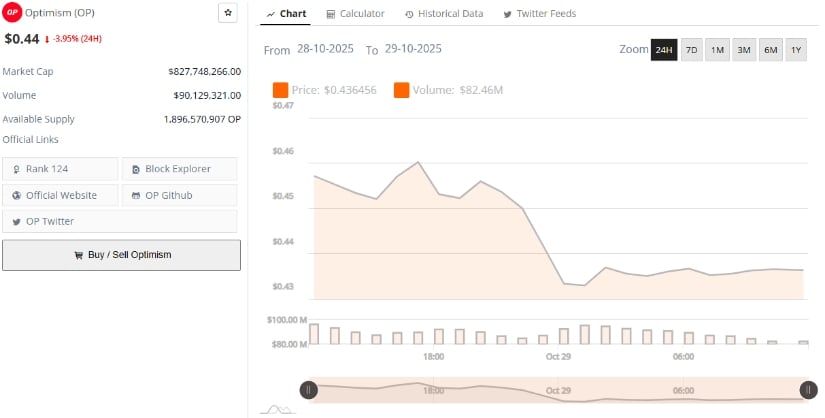
Source: BraveNewCoin
While the token continues to maintain moderate liquidity, the persistent drop in trading volume since mid-October indicates a cooling of speculative interest. Market data also shows that most activity is concentrated between $0.43 and $0.46, suggesting that buyers are hesitant to accumulate aggressively amid broader market uncertainty.
At the time of writing, OP/USDT is priced at $0.4355, with price movement exhibiting a muted recovery attempt following a steep decline earlier in October, according to TradingView data. The Relative Strength Index (RSI) currently stands at 35.51, while the RSI-based moving average is at 32.88, both indicating sustained bearish momentum. The oscillator remains below the neutral 50 level, indicating that selling pressure continues to dominate.
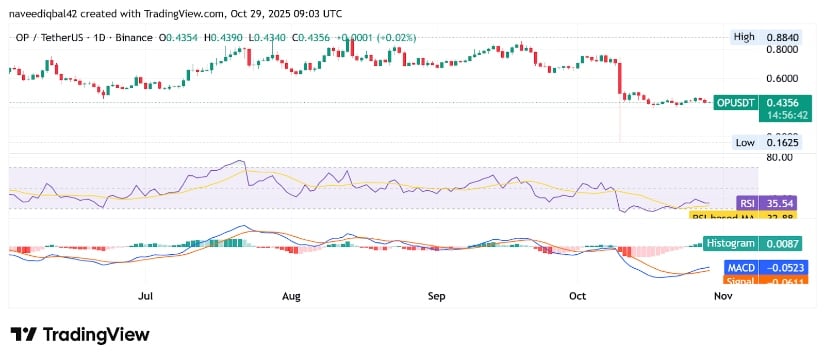
Source: TradingView
The MACD indicator further confirms this view, showing a main line reading of -0.0523 against a signal line of -0.0611, with the histogram printing a modest positive value of 0.0087 — suggesting that while short-term relief may occur, overall momentum remains negative. The price remains well below its 50-day moving average, reinforcing the view that any rebound from this region may struggle to sustain traction without a renewed volume influx.

