
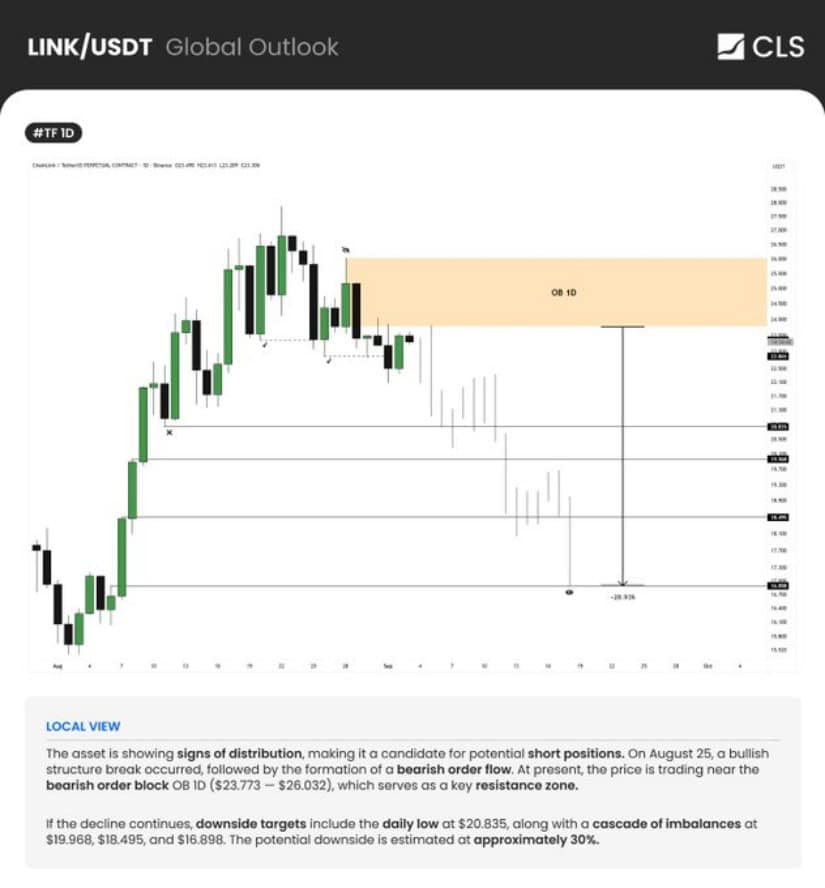
The token is currently trading around $23.44, reflecting modest gains of 1.53% over the past 24 hours but remaining trapped beneath a critical bearish order block between $23.77 and $26.03. This zone has repeatedly halted upside attempts, illustrating sustained selling pressure and distribution.
Analysis from CLS Global (@CoinLiquidity) points to a clear distribution phase unfolding after the bullish structure broke on August 25, marking a transition to bearish order flow. The price has failed to reclaim levels within the bearish order block, which represents a supply zone preventing further rallies. Each retest within this resistance band intensifies selling momentum, reinforcing downward pressure.
Source: X
The chart depicts a series of lower highs and lower lows, supporting the view of weakening bullish momentum and ongoing distribution. This pattern suggests that liquidity is being absorbed ahead of a potential deeper decline. Key downside targets begin at the daily low near $20.835.
Additional price levels offering possible support lie at $19.968, $18.495, and notably $16.898. These represent imbalances and liquidity voids that could attract selling interest, potentially resulting in a total drop of approximately 30% from current levels if bearish control persists.
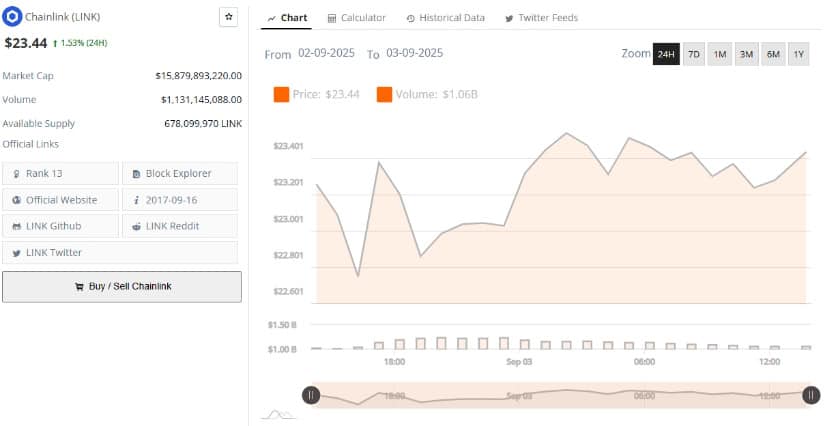
Despite the broader bearish outlook, intraday price action reveals that buyers have stepped in around short-term support near $22.60 after early session volatility. This defense helped the price recover into the $23.20–$23.40 range, indicating accumulation at lower levels. Mid-session strength pushed the token above $23.40, reaching the day’s peak before a minor pullback to retain higher lows.
Source: BraveNewCoin
Trading volume remains healthy at about $1.06 billion, confirming active market participation but not strong enough to drive a decisive breakout above resistance. The short-term bias leans cautiously bullish only as long as price holds above $23.00. For further upside moves, a sustained close above $23.40–$23.50 is required. Failure to maintain current levels may prompt retesting support around $22.80–$22.60, increasing downside risks.
With a market capitalization of $15.87 billion and ranking 13th among cryptocurrencies, the token maintains its position as a strong mid-cap asset, though volatility near these critical zones demands close attention.
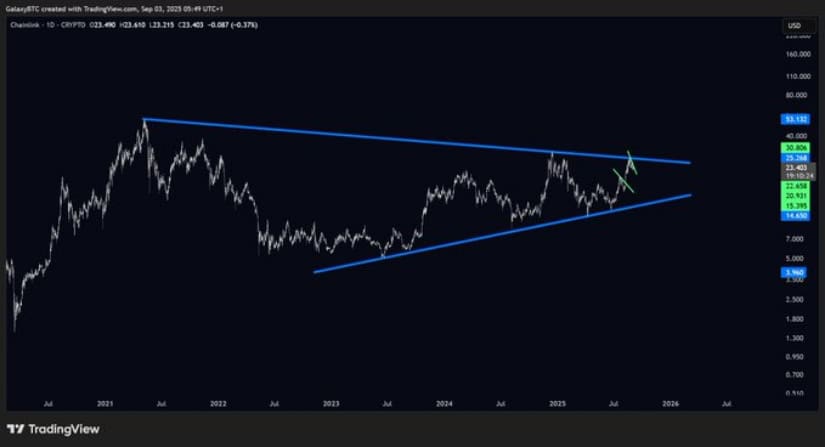
Another analyst from X, Galaxy (@galaxyBTC) highlights Chainlink’s long-term price action within a symmetrical wedge pattern, tracing back to 2021. The price continues compressing between successive lower highs and higher lows, tightening toward the wedge’s apex. At current levels near $23.40, the token is approaching the wedge’s upper resistance between $30.50 and $33.00.
Source: X
This setup signals that volatility could increase soon as the asset nears a decisive breakout zone. While the market has maintained higher lows, suggesting tentative accumulation, the wedge’s resistance still caps bullish momentum. Should the token break convincingly above $30.50–$33.00, a strong rally could follow, opening the door for extended gains.
Conversely, failure to breach resistance may result in the price falling back to mid-range supports of $19.00–$20.00 or even revisiting the wedge floor near $14.30. The tightening price action means the next directional move will play a crucial role in setting Chainlink’s mid-to-long-term trajectory.

