
The token is finding itself in the spotlight again as trading patterns tighten around key levels. Market conversations across platforms suggest momentum is building steadily. Many observers believe the groundwork for a stronger run may already be in place.
In a recent X post, Okan shared a wedge structure that has been compressing for months, with price action now pressing the upper boundary. The setup points toward a possible breakout, marked by Fibonacci retracement targets that stretch toward $0.50 and $1.20. The gradual pressure seen in candles suggests energy is being stored for a decisive move.
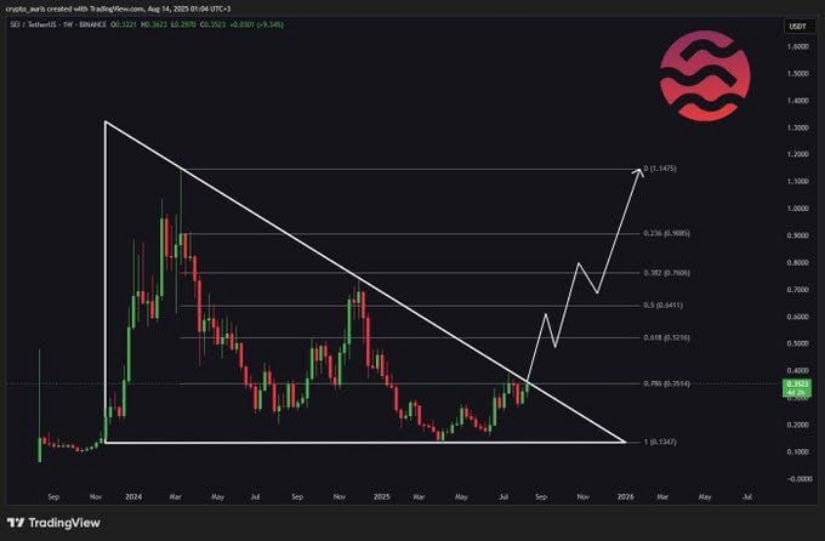
Source: X
The chart also highlights how past retracements have aligned neatly with accumulation points, indicating that traders are using dips for positioning. This rhythm has built confidence that consolidation phases are part of a larger bullish structure. As the token holds firm above support, the probability of expansion grows stronger.
The wider community has echoed the same outlook, with discussions noting that the long sideways trading has reduced selling fatigue. In many ways, the market seems to be waiting for a catalyst to push momentum forward. Long green candles remain the central expectation as the breakout edge draws closer.
Recent data from BraveNewCoin shows the token trading at $0.29 after a 3.94% gain in 24 hours, paired with steady liquidity. Market cap stands at $1.75 billion while trading volume holds above $150 million, showing strong participation across exchanges. These numbers suggest a market that is active yet not overheated.
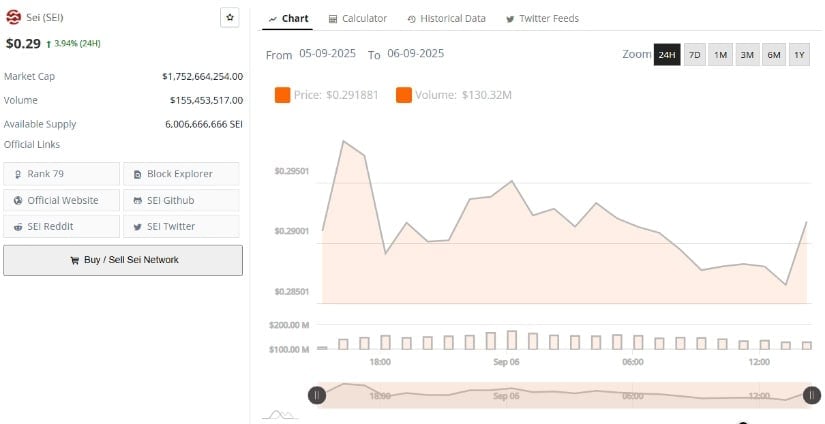
Source: BraveNewCoin
The narrow intraday swings reflect consolidation, where price holds within tight ranges while building strength for larger moves. Liquidity levels confirm that, despite mild volatility, there is no shortage of market depth to absorb trades. This gives stability as buyers and sellers continue testing boundaries.
The available supply sits at just over 6 billion, a factor that continues to shape sentiment among traders. Conversations around tokenomics have often centered on supply pressure, yet the data suggests demand is matching flow. That balance helps explain why the market appears calm even during short-term pullbacks.
At the time of writing, Sei coin was trading at $0.2860, showing a slight 1.82% dip on the day while holding above recent lows. RSI stood at 46.06, pointing to neutral momentum where bulls and bears remain evenly matched. MACD values hovered close to crossover territory, a point where shifts often begin.
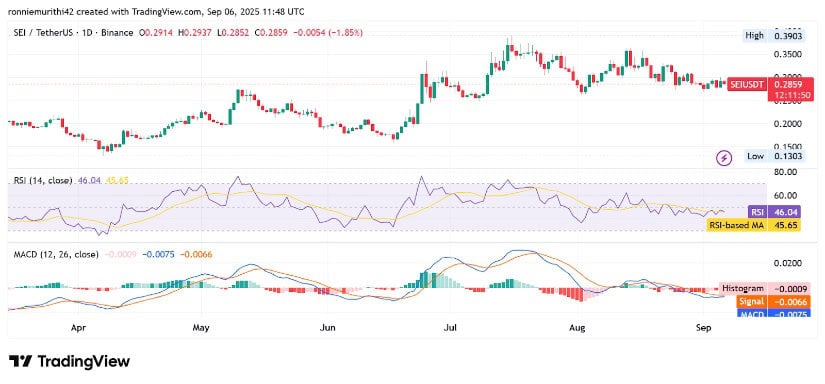
Source: TradingView
The histogram reflected a mild contraction in selling pressure, with bars shrinking after recent red runs. Momentum signals suggest that bears may be running out of steam as buyers prepare to reassert themselves. This balance can set the stage for gradual trend reversals.
Sei whale activity impact has been noted in recent sessions, drawing parallels to broader liquidity moves across the sector. Still, the token’s structure remains independent as candles respect major supports. This independence has allowed the market to carve its own path while holding steady around critical levels.


