
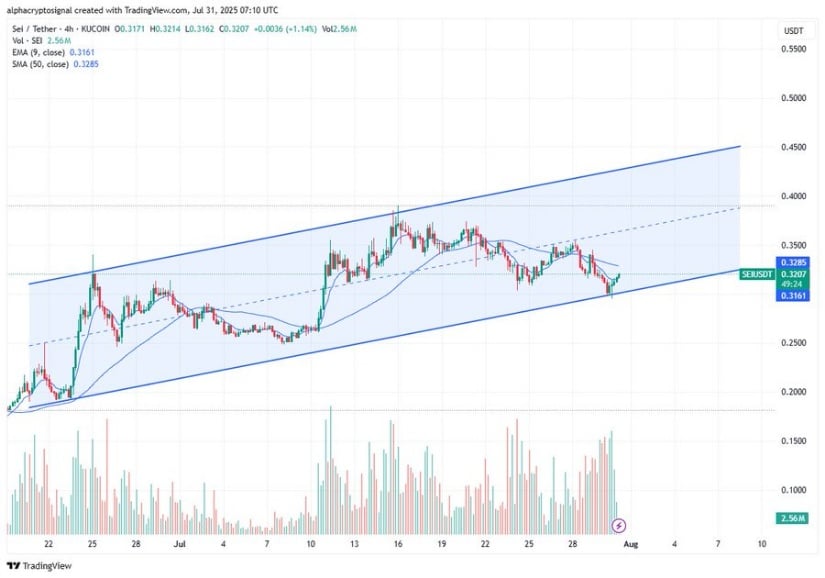
The token respected its ascending trendline and 9-EMA, sparking optimism for a mid-range revisit. Trading volumes remain stable, hinting at a controlled build-up rather than speculative spikes. At the time of writing, SEI trades at $0.3200 with technical indicators presenting mixed signals.
The 4-hour SEI/USDT chart, shared by Alpha Crypto Signal, highlights a bounce off the channel’s lower boundary near $0.31. This level has served as a consistent support zone since June, aligning with the 9-EMA and reinforcing the price’s upward structure.
SEI currently holds above this short-term moving average at $0.3161, while the 50-SMA, now near $0.3285, remains the next immediate resistance.
Source: X
The bounce coincides with a rise in volume, adding conviction to the move and supporting the probability of further upside. The chart suggests potential price targets at $0.35 for the mid-range and $0.43–$0.45 at the channel’s top.
Technical strength at the lower boundary and bullish higher-low formation remain intact, signaling trend continuation unless the structure is broken. Should the price fall below the channel and EMA support, targets shift lower to $0.29 and $0.26.
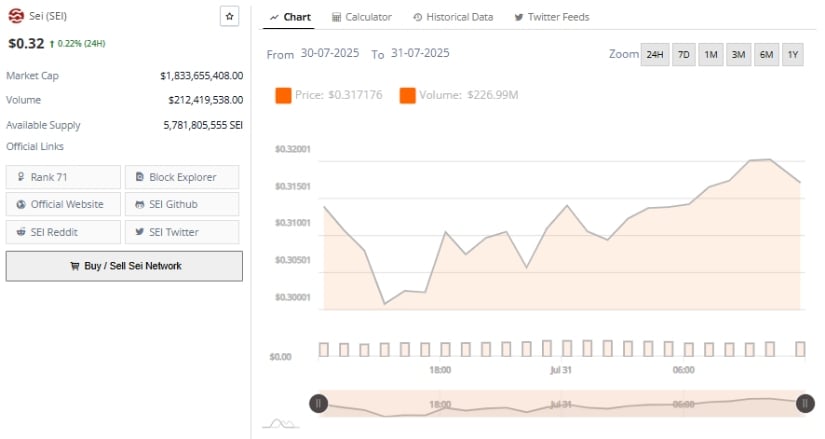
Between July 30 and July 31, 2025, SEI maintained an orderly intraday uptrend, forming a sequencee of higher lows and higher highs. The token began the session around $0.313, briefly dipped toward $0.300, and then reversed direction with sustained buyer interest.
The price reached an intraday high of $0.32001, reflecting a gradual but confident recovery from early weakness.
Source: BraveNewCoin
The return above $0.315 reestablished control for bulls and opened the door for a near-term push. Trading volume during this 24-hour window was consistent, totaling $226.99 million. This steady activity indicates ongoing market engagement without volatility, suggesting a potential accumulation phase.
However, resistance at $0.325 may pose a hurdle unless the price closes above it with stronger momentum. Holding above $0.310 remains key for maintaining a bullish posture.
On the daily chart, SEI posted a 2.33% gain over 24 hours, rebounding from a recent dip to $0.31. The asset is testing minor resistance zones established in mid-July, yet remains within a broader consolidation pattern.
A decisive breakout above $0.34 would be required to validate a new bullish phase. Until then, SEI’s movement reflects a recovery effort within defined range boundaries.

Source: TradingView
The MACD indicator currently signals a slowdown in momentum. The MACD line at 0.0095 sits below the signal line at 0.0164, and the negative histogram value of -0.0069 suggests a bearish crossover.
Meanwhile, the RSI reads 51.03, slightly above the neutral midpoint. A bearish RSI divergence has emerged, with price making higher highs while RSI trends lower. If RSI holds above 50, the market structure remains favorable, but a drop below that level could invite further downside toward $0.28–$0.30.

