
The token’s recent slide reflects weakening buying interest and a cautious market mood. As open interest drops alongside the declining price, traders appear hesitant, with the balance tipping in favor of bears. The question now is whether $0.86 can hold or if the token will continue its downward march.
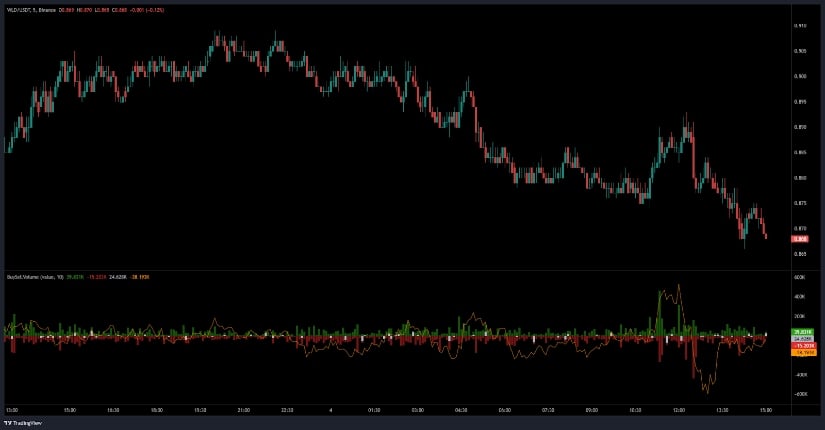
The Open Interest chart on the 5-minute timeframe paints a clear picture of bearish dominance. Price steadily fell from around $0.91 to near $0.868, forming a pattern of lower highs and lower lows—a hallmark of sustained selling pressure.
Brief attempts to bounce back near $0.885 quickly faded as sellers regained control, revealing a lack of sustained demand. The candlesticks reflect this struggle vividly, where every rally is met with renewed selling intensity.
Source: Open Interest
The Buy/Sell Volume indicator mirrors this sentiment, with sporadic buy volume green bars consistently overshadowed by larger sell volume red bars. Net order flow lines show sharp negative spikes during price drops, signaling aggressive liquidations and stop-loss cascades.
Although there are occasional brief surges in buying activity, these have been too fleeting to change the prevailing downtrend. This confirms that the bears currently hold the upper hand as WLD edges toward critical support.
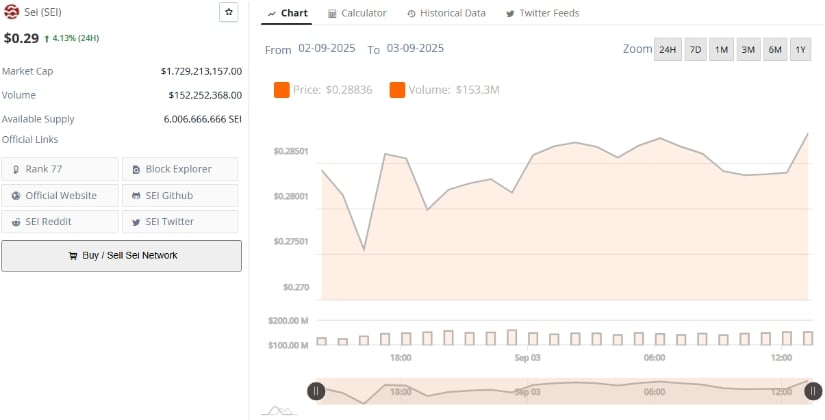
Turning to the 24-hour TradingView data, WLD has been navigating a tough session. Starting around $0.89, it tested an intraday high near $0.91 before selling pressure forced multiple dips. The token slid as low as $0.87, only to bounce strongly late in the session.
This back-and-forth reflects a volatile tug-of-war between buyers stepping in near the $0.87–$0.88 range, which has emerged as a crucial short-term support zone, and sellers pushing for lower levels when momentum falters.
Source: BraveNewCoin
Volume remained steady through these swings, suggesting active trading but no decisive dominance. The quick rebounds from support show buyers are still present, cushioning price declines, yet the inability to sustain gains near $0.90 indicates cautious bulls.
Traders will be closely watching whether the asset can hold above this support band—if it fails, the path to further losses could accelerate, while a bounce might spark a short-term relief rally.
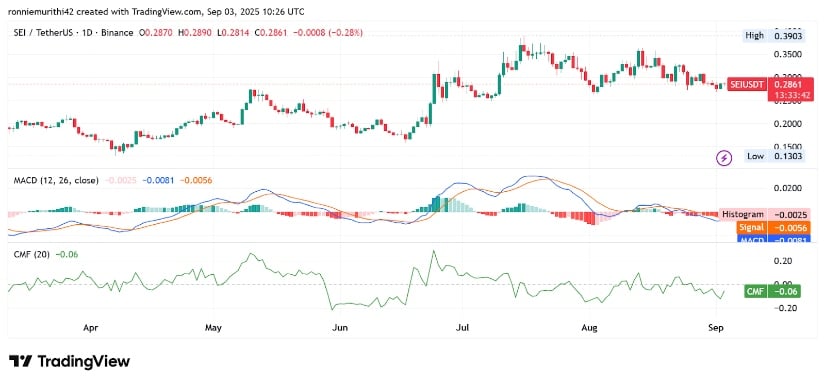
On the daily chart, WLD is trading near $0.867, down 3.34%, and pressing against the lower Bollinger Band at roughly $0.835. This proximity to the band suggests oversold conditions, a potential setup for a bounce or continued bearish pressure if sellers remain aggressive.
The middle Bollinger Band at $0.934 remains well out of reach and currently acts as resistance, reflecting the distance bulls must cover to regain control.
Source: TradingView
The Relative Strength Index (RSI) at 41.78 further supports this cautious outlook, sitting below the neutral 50 and highlighting diminished buying momentum. The RSI’s position beneath its moving average confirms that sellers currently outweigh buyers.
While oversold readings can hint at a near-term reversal, it’s clear that a recovery won’t come without renewed buying strength, ideally confirmed by a break above the $0.934 level. Until then, the risk of further downside toward $0.80 or even lower remains.

