
The weekly chart records higher lows and higher highs, showing steady buyer interest. On the daily timeframe, the altcoin trades above major moving averages, with only the 200-day EMA left as critical resistance. CRG notes that price is attempting to break this barrier while holding above the reclaimed quarterly value area, confirming solid support and ongoing accumulation.
In addition, analyst Inmortal highlights a clear accumulation and breakout pattern on the 12-hour chart. Price is rebounding from long-term support near $0.000090, targeting the $0.00017–$0.00018 region if momentum persists. Combined with robust trading volume near $84.4 million, these factors suggest a strong base for the next upward phase.
The asset maintains a constructive structure on its weekly chart with consistently higher lows and higher highs. This pattern indicates that the market has sustained upward momentum over recent weeks. Analysts observing the long-term trend see these price actions as evidence that buying interest is present despite periods of consolidation.
On the daily timeframe, the altcoin trades above most of its critical moving averages. The only remaining resistance is the 200-day exponential moving average (EMA), a key level many traders use to confirm major trend changes. Moreover, the current market action indicates that the price is attempting to close above this line, which could encourage further upside if successful.
Analyst CRG notes that the token has reclaimed and retested the quarterly value area, a development that strengthens the current structure. Price recently rebounded from the lower band of this zone and is now trading above it, indicating that demand is firm near the Q2 2025 value area low. Sustaining this position supports the view that the market is still in an accumulation stage.
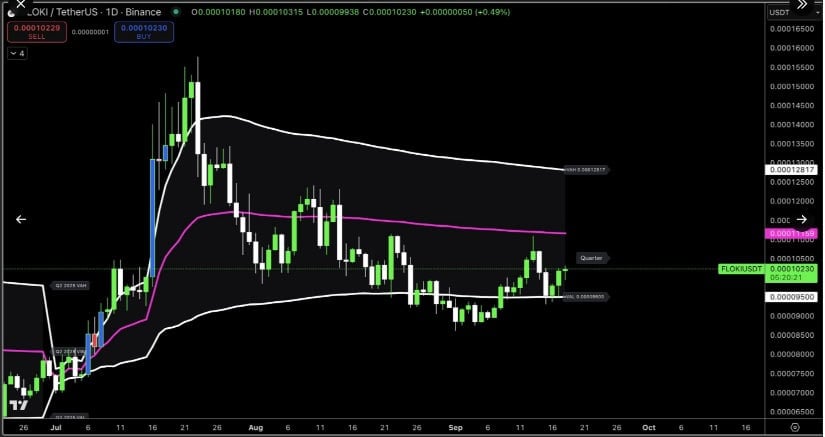
FLOKIUSDT 1-Day Chart | Source:x
Remaining above this quarterly value range provides a reliable base for the next potential move. Traders often view such retests as a positive technical sign because they confirm that previous resistance has shifted into support. The stability of this area can help define risk levels and guide short-term trading strategies while the market awaits a decisive breakout.
Another perspective comes from analyst Inmortal, whose 12-hour chart shows a clear accumulation and breakout pattern. The asset has repeatedly tested and rebounded from horizontal support near $0.000090, with blue zones marking past shakeouts followed by rapid recoveries. This repeated defense signals that buyers continue to absorb selling pressure at lower levels.
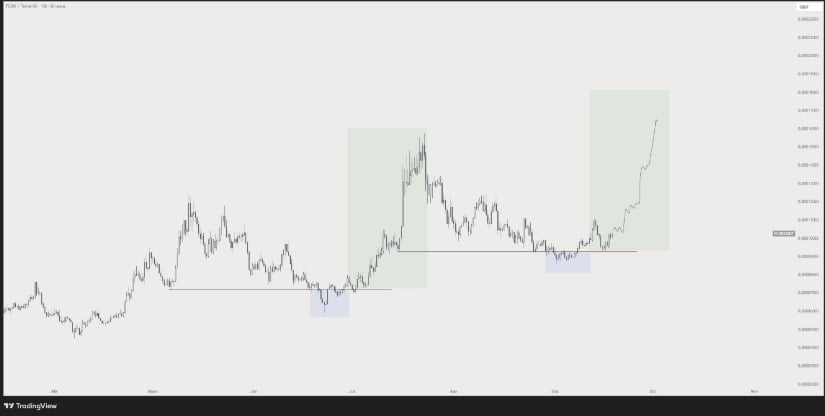
FLOKIUSDT Chart | Source:x
Inmortal compares the current structure to its rally earlier in July. A similar projected path indicates potential upside toward the $0.00017–$0.00018 range if price can decisively clear overhead resistance around $0.00011–$0.00012. The market is therefore positioned to attempt another strong upward leg once confirmation of the breakout appears.
The cryptocurrency is trading at approximately $0.0001027, representing a 0.74% increase over the last 24 hours. Trading volume stands near $84.4 million, and the market capitalization remains close to $992.7 million, reflecting sustained liquidity. The available supply is about 9.65 trillion tokens, supporting a deep and active market for buyers and sellers.
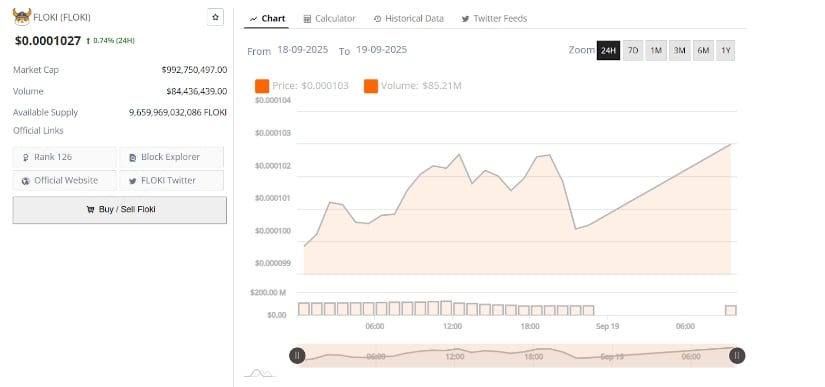
FLOKIUSD 24-Hr Chart | Source: BraveNewCoin
Intraday price movement shows quick advances followed by brief consolidations, with higher lows reinforcing a short-term bullish stance. Early sessions lifted the price above $0.000103 before a minor pullback and recovery, demonstrating continued demand. If momentum persists and the 200 EMA is breached, analysts expect it to extend its gains and move toward higher targets while maintaining key support levels.


