
This latest move comes as technical and on-chain signals begin to align, boosting confidence in the Solana price prediction for further gains. From a higher-low formation above the 50 EMA to growing buy-side liquidity, the market setup is leaning bullish and could pave the way for a retest of higher resistance levels.
Solana’s long-term range remains well-defined, with $140 acting as a key structural support and $250 marking the upper boundary. The current market view from ColdBloodShill suggests that as long as SOL continues to defend the $140 zone, the probability of an eventual push towards the $250 resistance remains intact. This level has historically served as a strong reaction point, attracting both buyers looking to accumulate and sellers taking profit.
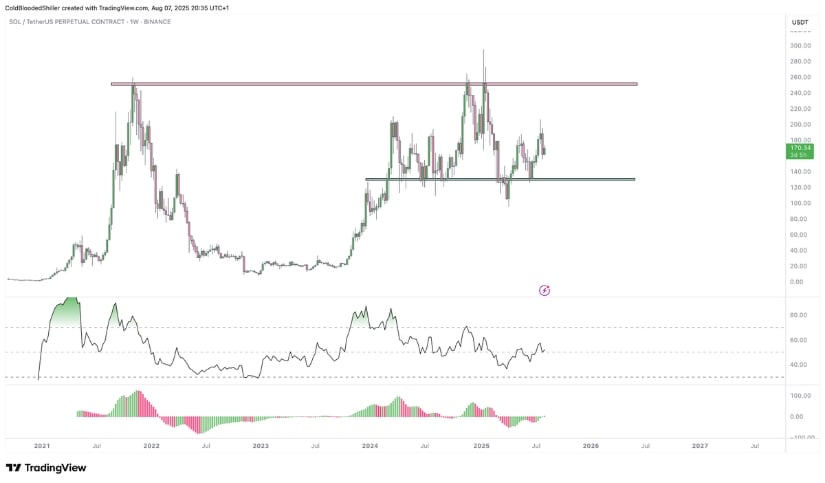
Solana defends its $140 support while eyeing a potential breakout towards $250. Source: ColdBloodShill via X
RSI remains mid-range without flashing extremes, leaving room for momentum to build if price can sustain higher lows into the resistance zone. If buyers can maintain control above $140, gradual compression toward the top end of the structure becomes likely. Meanwhile, a breakout through $250 would clear the last major supply zone on the chart, potentially setting the stage for a more extended rally.
On-chain realized price distribution data highlights $165 as a major mid-range support, backed by dense historical trading activity. This level has acted as a stabilizing point in previous cycles, making it a natural area for buyers to step in if the price pulls back. Above it, the $177 and $189 zones remain the most immediate resistance areas to watch.
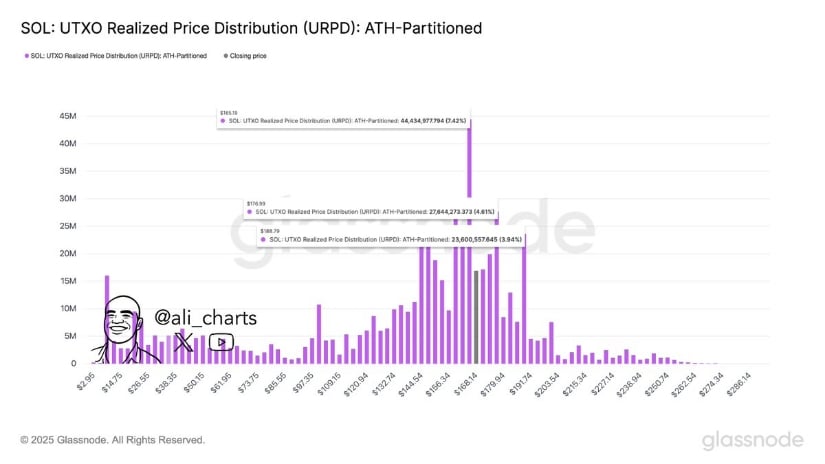
Solana’s $165 support emerges as a key mid-range anchor, reinforcing bullish structure towards the $189 zone. Source: Ali Martinez via X
Holding above $165 would keep the current market structure intact, allowing the price to press back into the $177 to $189 range. A clean break through that zone could reopen the path towards higher-range targets.
Solana has now triggered a breakout from its descending channel, breaking through the mid-line with conviction and targeting the upper boundary near $177. The breakout also aligns with previously highlighted resistance zones, reinforcing the importance of the coming retests in confirming a sustained shift in trend.
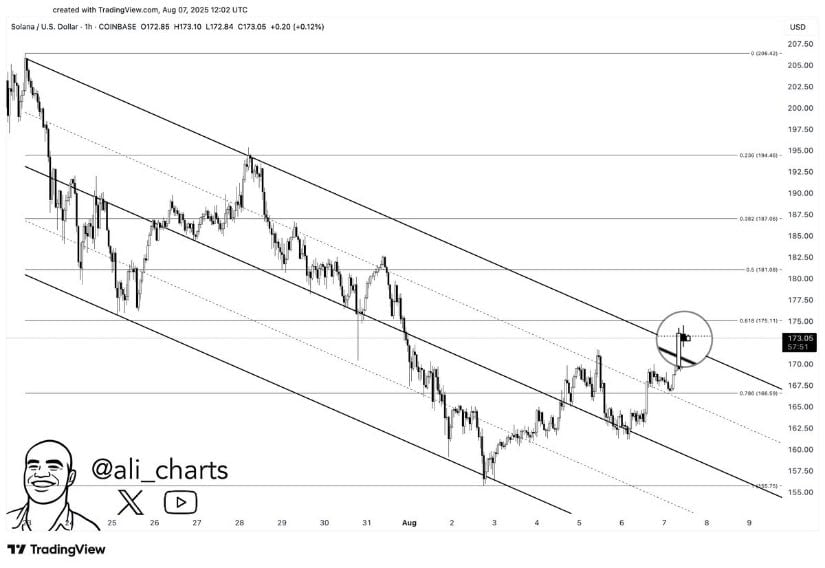
Solana breaks out of its descending channel, eyeing the $177–$189 resistance zone for the next bullish push. Source: Ali Martinez via X
If SOL can hold above $173 on closing timeframes, momentum could carry price into the $177 to $187 region, with $189 acting as the next key cap. Indicators remain balanced, leaving scope for continuation without immediate overbought risk.
SOL’s daily chart shared by Crypto Target is showing a clean higher-low formation above the 50 EMA, with both the 100 EMA and 200 EMA trending upward beneath it. This layering of moving averages is a constructive sign for maintaining a bullish structure. The fact that price has respected these zones on multiple occasions this year suggests buyers are stepping in consistently at these levels.
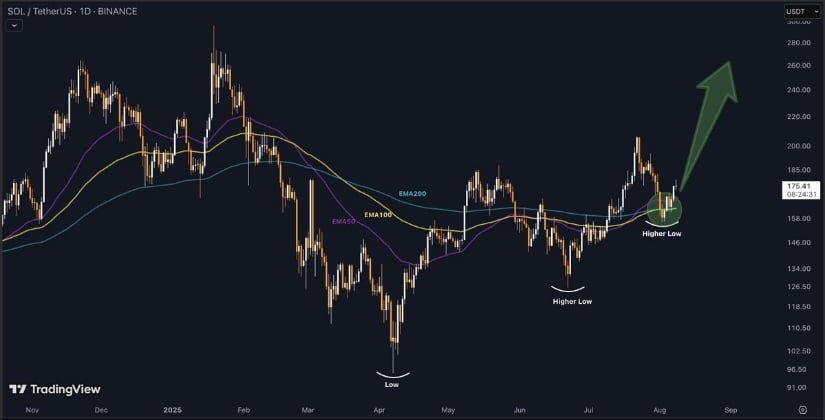
Solana forms a higher low above key EMAs, with a golden cross signaling momentum toward the $250 to $260 range. Source: Crypto Target via X
Adding to the bullish case, the EMAs are currently aligned in a golden cross formation, with shorter-term averages positioned above the longer-term ones. This configuration reflects a market environment where momentum is shifting in favor of buyers, often acting as a trend continuation signal. If price holds above this cluster, the path toward retesting the $250 to $260 zone remains technically supported.
Order flow data from Blockchainedbb shows a steady climb in buy-side absorption, with significant bid clusters appearing just above the $174 zone. This aligns closely with the recent breakout structure, where holding above this area would keep buyers in control. The chart also points to concentrated liquidity at $177 and $194, marking the next potential magnets for price if momentum continues.

Large bid walls near $174 signal strong buy-side interest, with liquidity targets set at $177 and $194. Source: Blockchainedbb via X
The lack of heavy sell-side imbalances overhead until the $189 to $194 range suggests a relatively clean path in the short term.
Solana’s ability to defend $140 and reclaim key zones like $165 and $173 has kept its bullish structure intact. The recent breakout from the descending channel, combined with rising EMAs and clear liquidity targets up to $194, gives SOL a strong technical foundation for further gains. If momentum holds, the climb toward $189 and eventually $250 remains firmly on the table.

