
This morning, the Reserve Bank of New Zealand (RBNZ) cut its key interest rate. According to Forex Factory, the Official Cash Rate was reduced by 50 basis points from 3.0% to 2.5%, while most analysts had expected a smaller cut to 2.75%.
Moreover, the RBNZ signalled the prospect of further easing following a recent deterioration in economic data. The decisive move caught traders off guard and led to heightened volatility. As shown on the NZD/USD chart, the New Zealand dollar has fallen to its lowest level against the US dollar since mid-April.
The downward momentum has been reinforced by the strengthening of the US dollar — possibly as investors grow more cautious over a potential government shutdown, prompting them to move into cash.
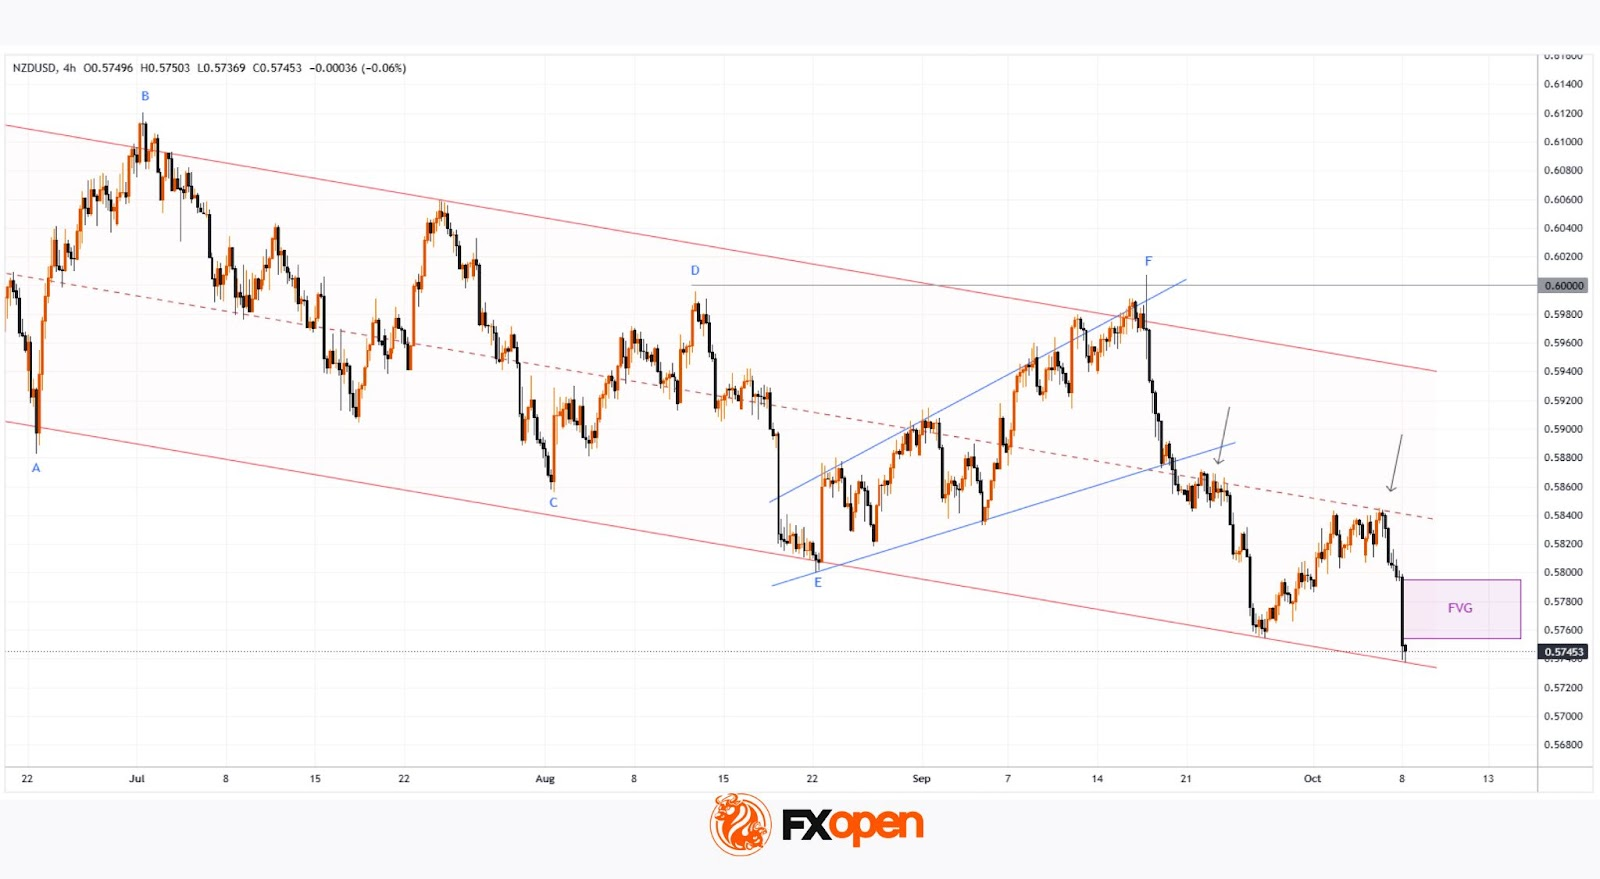
Movements in the kiwi’s exchange rate during the second half of 2025 have formed a descending channel on the chart. Notably, peak F:
→ only slightly exceeds the previous high D;
→ lies above the psychological 0.6000 level;
→ developed with a long upper wick, consistent with the Upthrust (UTAD) pattern described in Wyckoff methodology.
This appears to be a strategic false breakout above the lower-high structure, paving the way for a decline towards the autumn lows and a breakout below the corrective pattern (shown in blue).
From a bearish perspective:
→ the channel’s median line acts as resistance (as shown by the arrows);
→ today’s drop signals an imbalance favouring sellers, forming the basis for a Fair Value Gap resistance zone.
Meanwhile, bulls may hope the lower boundary of the channel once again acts as support in 2025, providing momentum for a rebound within the channel. For this scenario to play out, however, the news backdrop would need to shift. For now, the NZD/USD chart points to bearish dominance — with a potential move down towards the 0.5700 level.


