
This range, marked as an inefficiency zone, is viewed as the key area where the next decisive move will unfold.
In a recent post on X, analyst Swarmik described UNI’s expected trajectory toward the Point of Interest. The altcoin trend suggested a gradual recovery into the resistance band, followed by a reversal. This reflected a structured approach in line with bearish order flow.
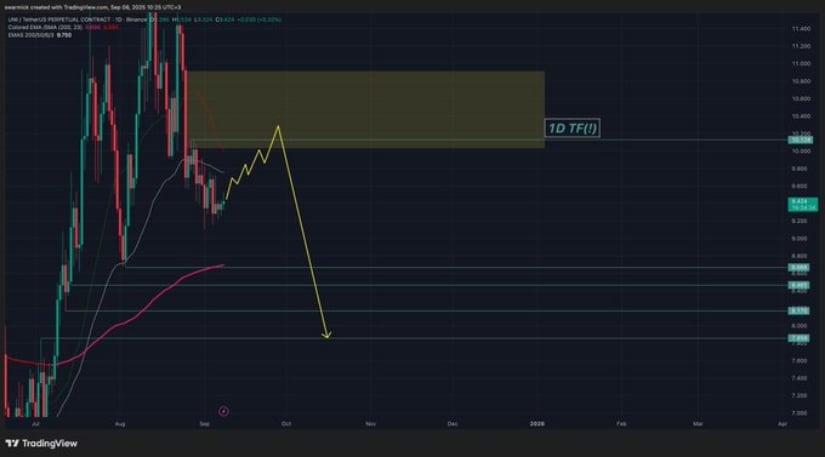
UNIUSD | Source: X
Whale activity added another layer to the story, with large wallets showing limited accumulation around current levels. This lack of aggressive buying from major players increases the likelihood of rejection at resistance. When whales stay cautious, retail traders tend to follow suit.
If the asset does reverse from this inefficiency zone, the chart points to a sequence of targets on the downside. These include $8.68, $8.47, $8.17, and $7.86, which represent the next key support zones for traders eyeing short positions.
Additionally, BraveNewCoin data shows the coin priced near $9.43, reflecting a marginal 0.22% increase in the past 24 hours. Market capitalization stands at $5.66 billion, with $158.8 million in daily turnover. These numbers highlight steady but cautious participation from traders.
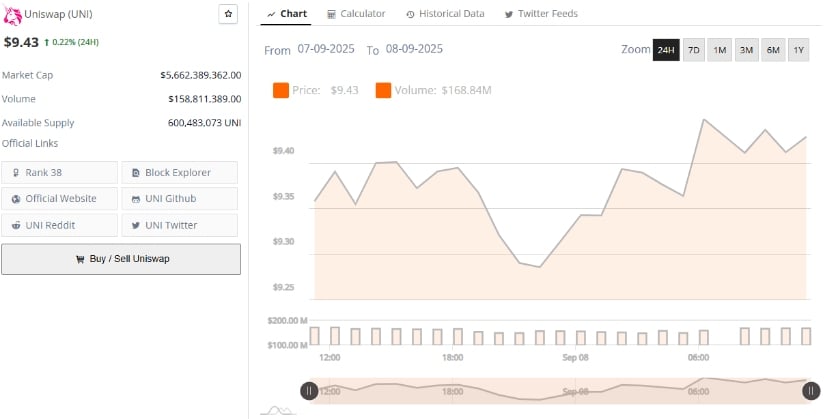
Source: BraveNewCoin
The price sits just below the $9.8–$10.3 range highlighted by Swarmik, where rebalancing is anticipated. If rejection occurs here, downside targets could be activated quickly. The 200-day moving average resting above current prices reinforces this bearish view.
Uniswap exchange continues to command strong liquidity, yet the mood appears defensive near resistance. Until momentum builds, rallies are seen more as opportunities to reset short trades rather than signs of a bullish breakout.
At the time of writing, according to TradingView, the Uniswap coin traded around $9.48 with a session high of $9.54. This narrow range reflects consolidation and hesitation, as traders weigh the resistance test against recent support near $9.
The Relative Strength Index (RSI) stands at 44.58, leaning slightly bearish but not yet oversold. Its close alignment with the RSI-based moving average at 44.14 signals balance but with a tilt to the downside. This leaves room for further weakness if resistance confirms.
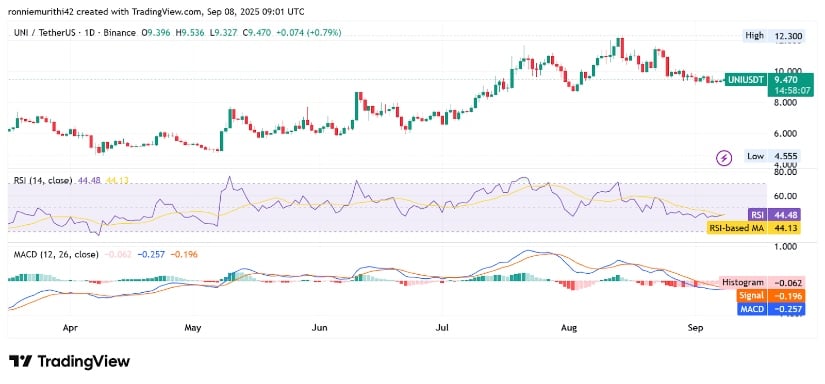
Source: TradingView
Meanwhile, the MACD indicator shows the MACD line at -0.257, below the signal line at -0.196, with a histogram value of -0.061. This setup reflects mild bearish momentum without steep acceleration. If rejection takes hold, Uniswap crypto could slide toward $8.17 and potentially $7.86 before year-end.
Overall, the asset remains in a pivotal position. The coming sessions will reveal whether the resistance band sparks another leg down or if the token surprises traders by breaking above with strength. For now, caution dominates sentiment as technicals favor the bearish roadmap.


