
This resistance zone, identified by analyst CW, may cause short-term price consolidation or a pullback as market participants react to the high volume of sell orders.The altcoin shows bullish momentum, nearing $895 and signaling further gains if it clears the sell wall.
Recent market activity shows its price fluctuating within a tight range, reflecting typical cryptocurrency volatility. A surge in trading volume, peaking at $1.16 billion, indicates strong investor interest, despite the retracement. As of the time of writing , the asset is at $874.25, reflecting a 0.91% decrease.
Binance Coin is encountering notable resistance around the $895 level, according to market analyst CW. The $895 mark has formed a significant sell wall, suggesting that upward movement could be stymied in the near term. This resistance zone is pivotal as it could lead to either a price pullback or consolidation if market participants react to the significant sell orders at this price point.
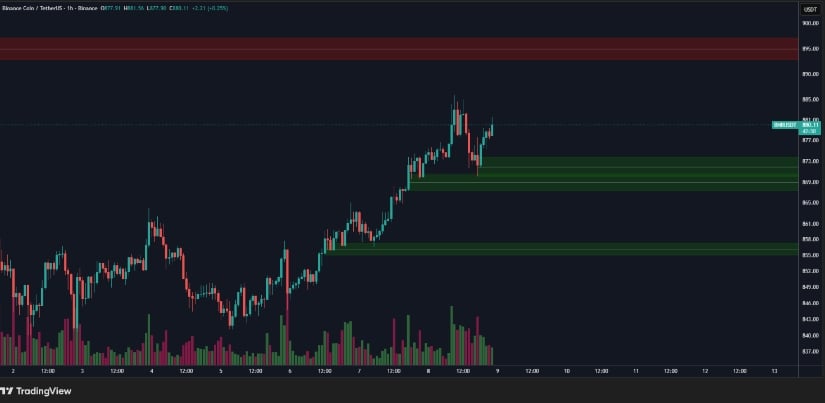
BNBUSDT 1-Hr Chart | Source:x
The altcoin has been trending upwards, fueled by strong bullish momentum, which is evident from the recent price action that broke key resistance levels. However, despite the upward trend, its current price is hovering just below the $895 resistance, indicating that buyers are attempting to push the price higher. However, a breakout above this level could trigger further price increases, but a rejection could result in a price correction, with the next support levels identified at $873 and $869.
The chart from Into The Cryptoverse provides additional context, focusing on the percentage drawdown from its all-time high (ATH). The graph illustrates significant fluctuations in its price since its inception, with particular attention given to market downturns that led to notable drawdowns in early 2018 and 2022.
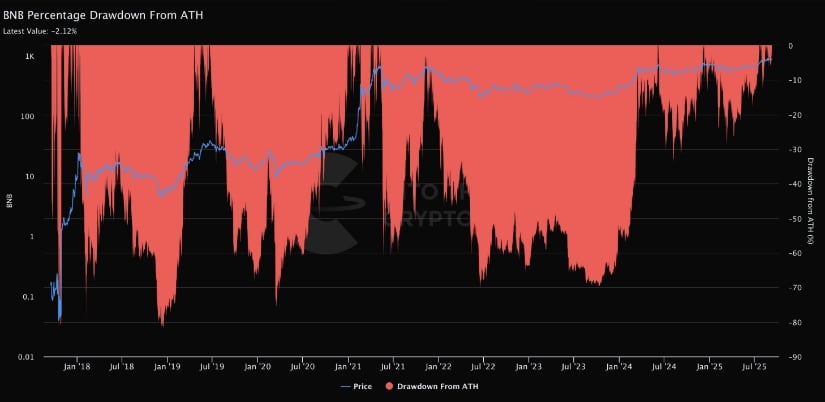
BNBUSD Chart | Source:x
As of the latest data, the current drawdown stands at -2.12%, indicating a relatively modest correction from its peak value. This drop is relatively mild compared to previous deep corrections during past bear markets, suggesting that it remains resilient in the current market environment. Analysts will continue to monitor these levels, as the current consolidation near the $895 resistance could indicate a potential for another breakout, supported by strong buying interest.
The 24-hour chart shows notable price swings. Starting near $875, Binance price surged early on September 8, briefly touching a high around $884. It then experienced a gradual pullback, closing at $874.25, a 0.91% decline for the period.
Trading activity remained elevated, with volume peaking at $1.16 billion. The heightened participation coincided with price peaks, signaling sustained investor attention. Despite the retracement, the consistent demand underscores ongoing confidence, reflecting bullish sentiment across the market.
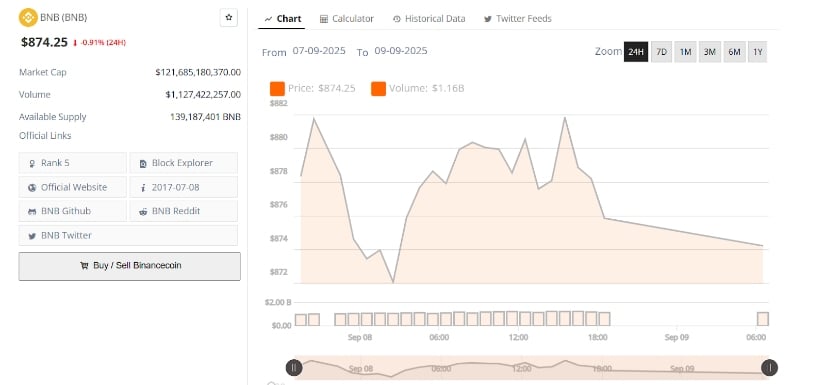
BNBUSD 24-Hr Chart | Source: BraveNewCoin
The $895 resistance zone remains critical for determining the Coin’s future price direction. However, the current price action suggests that the market is uncertain, and the sell wall at $895 could cause further price consolidation or a pullback before a possible push higher.
As Binance Coin consolidates near this resistance level, analysts will continue to monitor the broader market conditions, trading volumes, and investor sentiment. The price swings and rising market interest highlight its role as a key crypto, with potential moves hinging on resistance.


