
This zone has acted as a crucial support point, allowing the coin to maintain momentum and avoid deeper corrections. With past recoveries pushing the asset higher from stronger support areas, buyers are now watching whether the price can build strength toward the $0.60 region.
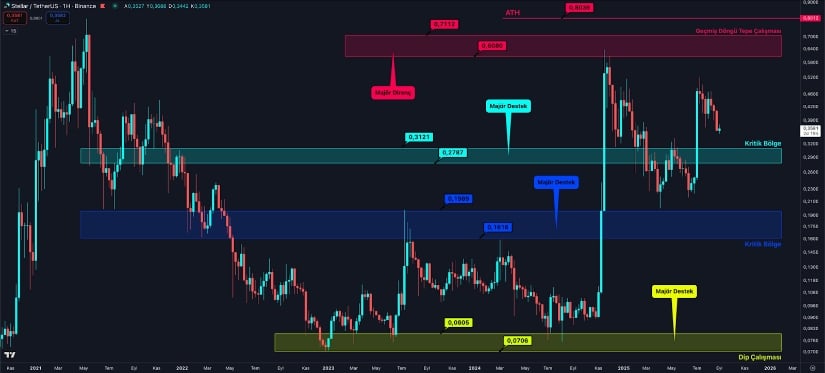
In a recent X post, analyst Berke Oktay noted that the coin continues to trade above the support range between $0.2787–$0.3121. The chart shows no negative developments at this stage, as buyers have successfully defended this area.
Historical data indicate that XLM crypto previously rebounded from lows near $0.0706–$0.0805, which sparked a recovery that broke past earlier resistance levels and set the foundation for the current structure.
Source: X
The wider chart highlights that maintaining this zone is key for stability while preparing for the next resistance test at $0.6080–$0.7112. This band has served as a rejection point in the past, making it a significant target for buyers.
Beyond that, the $0.1616–$0.1989 range remains an important safety net, while the all-time high at $0.8036 stands as the longer-term ceiling. For now, holding above $0.31 keeps the market steady and leaves the path open for attempts toward the $0.60 mark.
In addition, BraveNewCoin data shows Stellar trading at $0.35, reflecting a 2.67% dip in the past 24 hours. Trading volume stands at $157.9 million, while the market cap is valued at $11.2 billion. Despite this pullback, the price has continued to hold above the $0.35 mark, showing that buyers are defending this level.
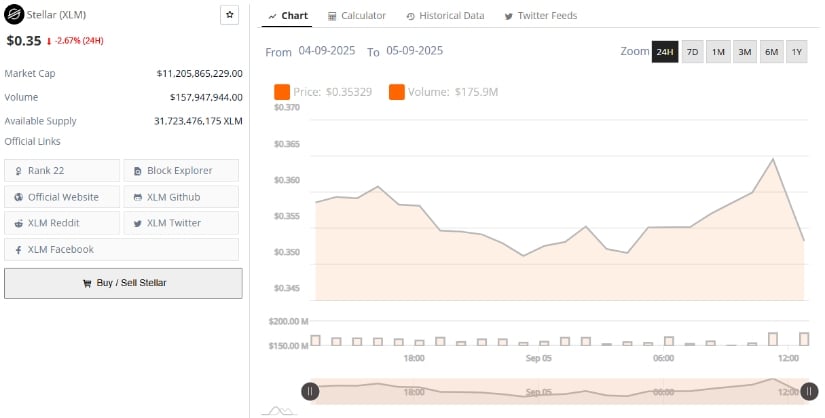
Source: BraveNewCoin
The chart highlights intraday moves between $0.34 and $0.36, suggesting short bursts of volatility without major trend changes. With a circulating supply of over 31.7 billion tokens, the coin has kept its position in the top 25 assets, pointing to ongoing market stability. This range has become an important zone where activity remains concentrated.
If the price holds firm above $0.35, the next test will likely be higher resistance levels near $0.60. Buyers appear focused on keeping the price stable in the short term, and the chart suggests consolidation rather than a deeper correction. The coming days will be key in showing whether momentum can build toward an upward move.
At the time of writing, TradingView data shows the price moving around $0.36 after testing highs near $0.52 in recent weeks. The Bollinger Bands suggest narrowing volatility, with the upper band at $0.43 and the lower band at $0.33. This signals a consolidation phase where the market is waiting for a clearer direction.
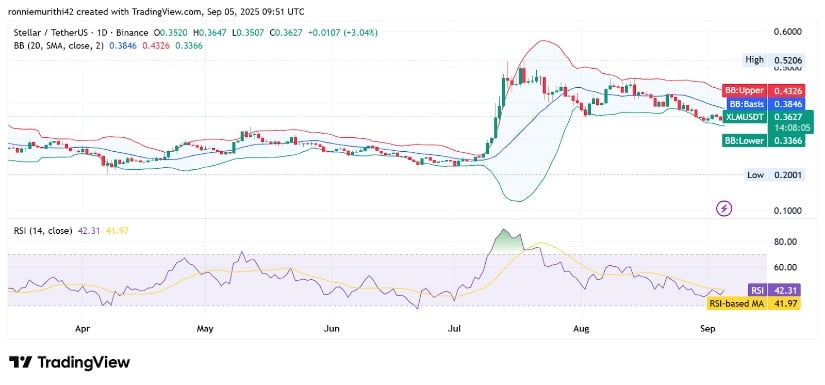
Source: TradingView
The Relative Strength Index (RSI) currently reads 42, placing the asset in neutral territory after a steady decline from overbought conditions earlier in the summer. The indicator suggests neither strong buying pressure nor heavy selling at this point. Momentum remains balanced, but traders are closely watching if the RSI dips further toward oversold levels.
Price stability near the mid-range of the bands shows how important the $0.35–$0.36 zone has become. A sustained hold here could set the stage for another upward test, while a break below $0.33 would raise the risk of deeper losses. For now, the charts show consolidation with both buyers and sellers waiting for a decisive move.

