
If you’ve ever studied candlestick patterns, you know they can reveal a lot about market sentiment. The Three Line Strike is one of those patterns that catches traders’ attention for its signals. The pattern can provide both reversal and continuation signals. In this article, we’ll break down what this pattern looks like, why it matters, and how you may use it in your trading plan.
The Three Line Strike is a candlestick pattern used in technical analysis to trade trend continuations. However, it often appears ahead of trend reversals. The pattern consists of four candlesticks and can be found in up- and downtrends.
*Note: Since this pattern is usually used to determine the continuation of a trend, we will consider continuation as its main signal.
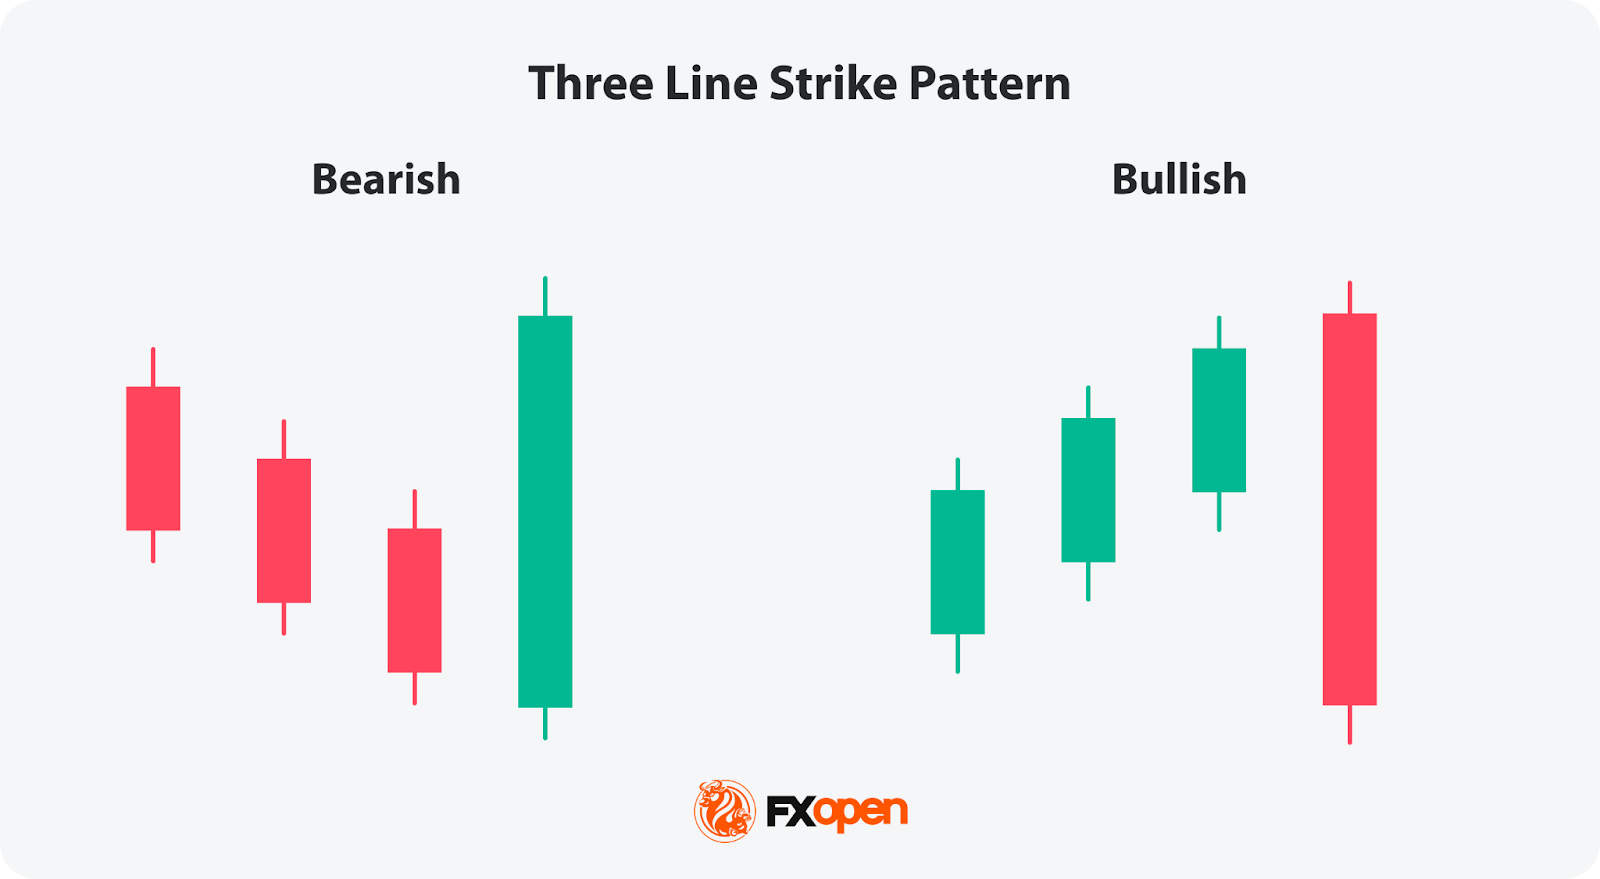
The bearish 3 Line Strike candlestick pattern suggests a continuation of a downtrend. It starts with three consecutive bearish candles, each opening and closing lower than the previous one. This is followed by a large bullish candle, which opens lower and closes above the open price of the first bearish candle. This pattern reflects the strength of the downtrend. Still, it may appear at the bottom of the downtrend and signal a trend reversal.
The bullish 3 Line Strike candlestick pattern suggests the potential continuation of a solid uptrend. It starts with three consecutive bullish candles, each opening and closing higher than the last. This is followed by a large bearish candle, which opens higher and closes below the close of the first bullish candle. This pattern indicates that the solid uptrend may continue, but it may signal the market will turn down if it’s formed at the peak of the uptrend.
Understanding psychological factors influencing market participants may help traders read signals of the Three Line Strike pattern. Greed, fear, hope, and anxiety drive buying and selling decisions.
Applying the 3 Line Strike pattern in trading strategies encompasses various elements beyond just its recognition. Let's delve into how traders implement additional steps.
As the Three Line Strike pattern can provide both reversal and continuation signals, it’s vital to combine it with other analytical tools, including trend indicators like moving averages and oscillators like the Relative Strength Index. Also, traders consider the overall trend on higher timeframes.
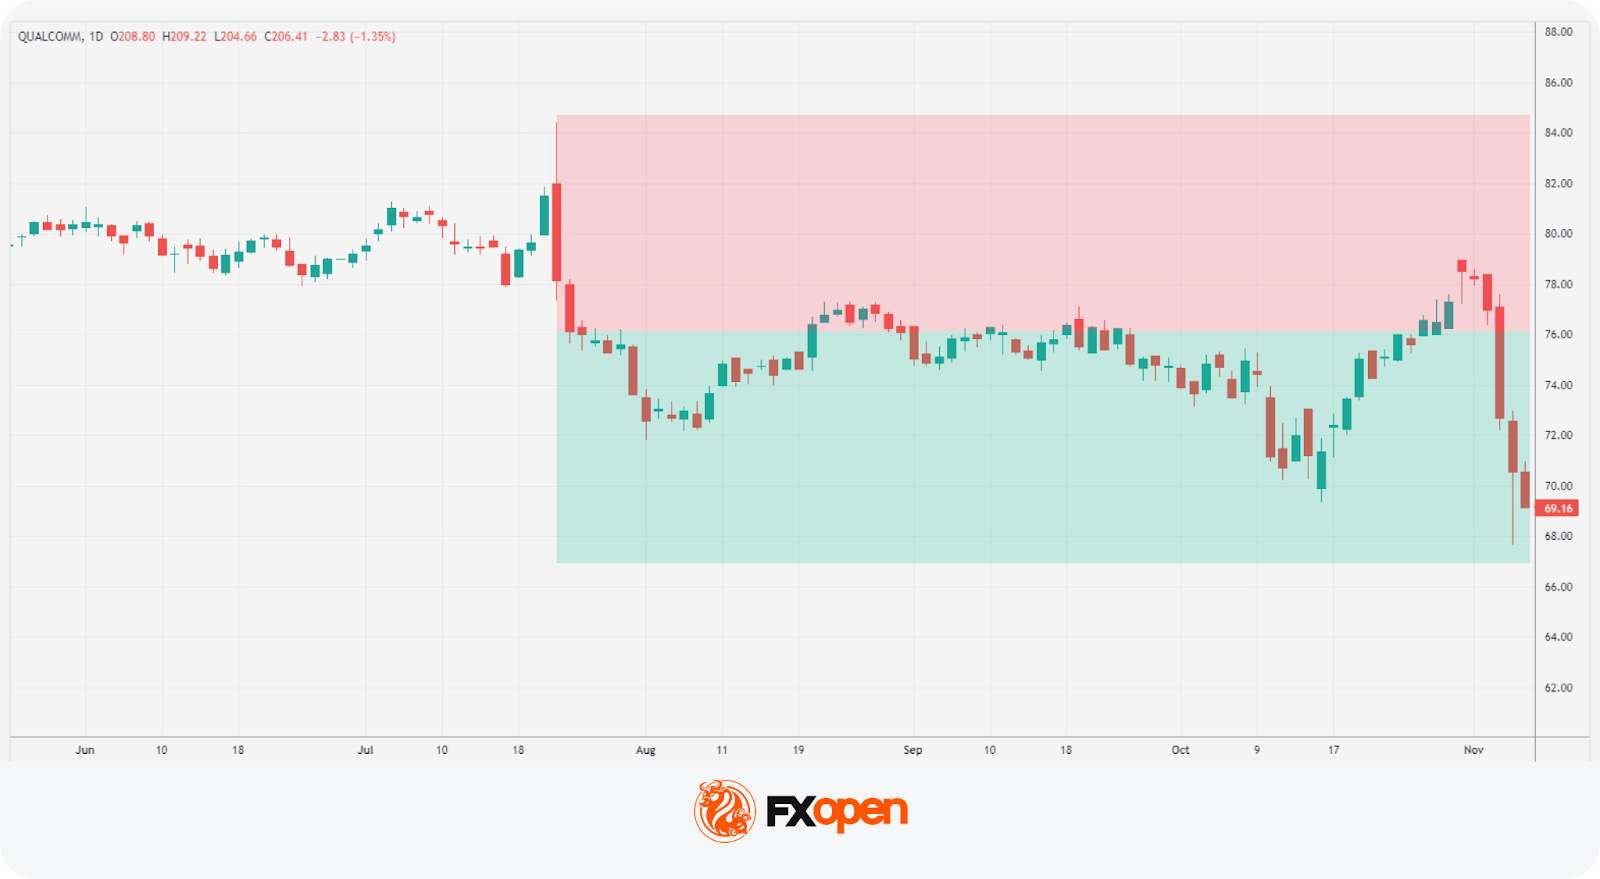
A trader finds a so-called bullish 3 Line Strike setup on the daily chart of Qualcomm stock. However, this time, it serves as a reversal signal, so it becomes bearish. They enter the short position at the close of the candle, following the pattern. Their stop loss is above the setup, with the take profit at the next support level.
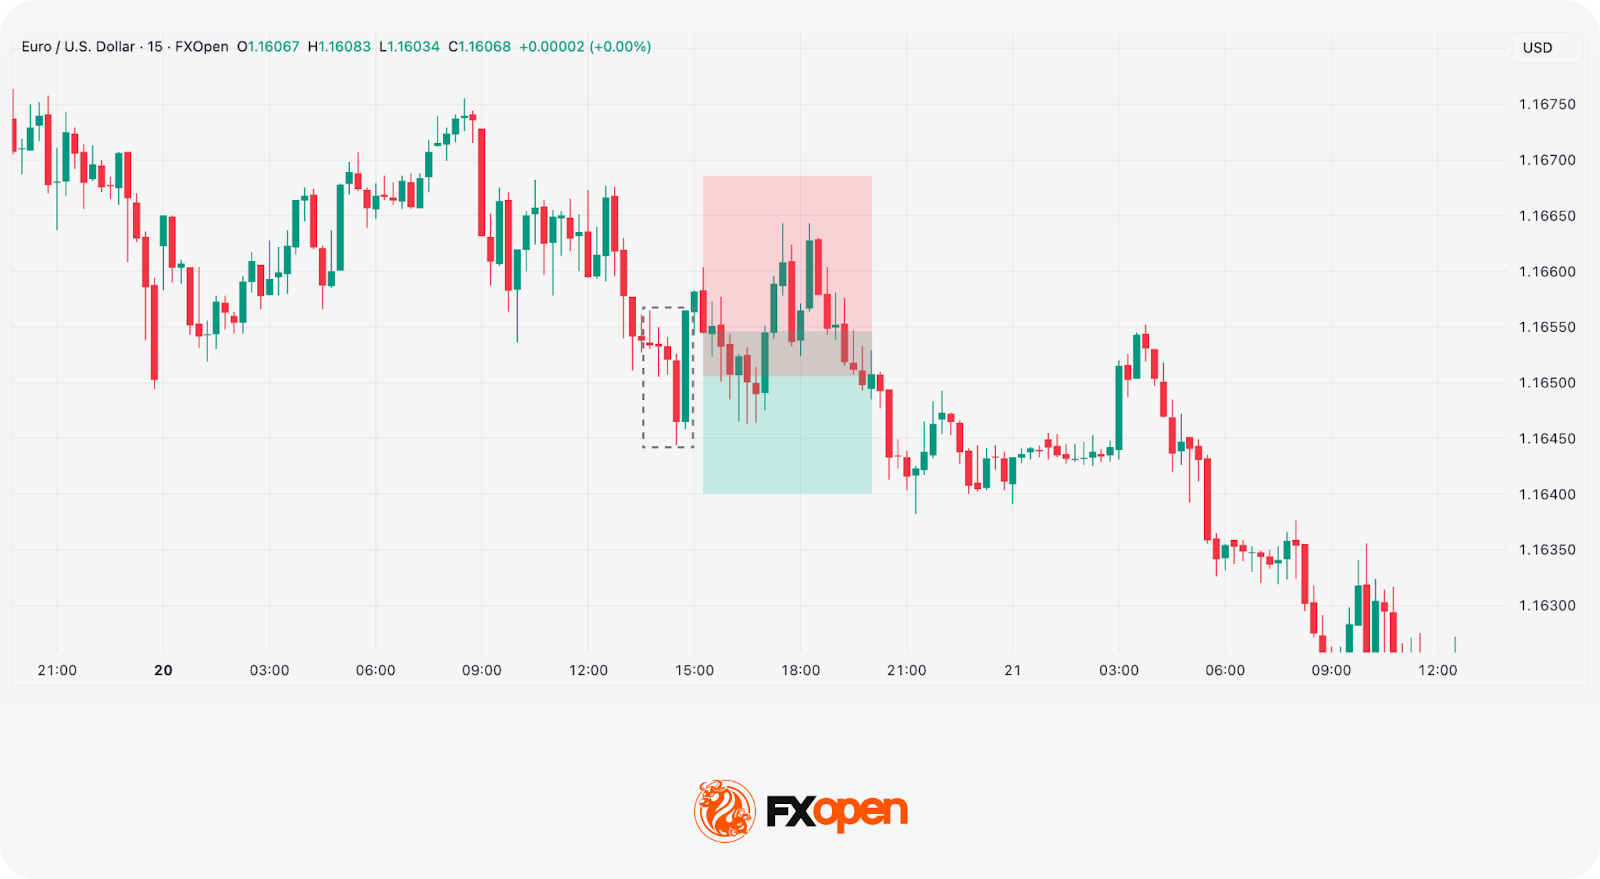
In the chart above, we see a bearish continuation 3 Line Strike. It’s not a perfect setup, as it may be difficult to determine a clear take-profit level. However, markets are never perfect. A trader waits for the first bearish candle to form after the pattern appears. Since this occurred during a long-term downtrend, they place a stop-loss order above the nearest consolidation range. Determining the take-profit level may be challenging, but a trader closes the trade partially to avoid a trend reversal and a premature trade exit.
If you want to explore the Three Line Strike pattern, you can consider heading over to the FXOpen’s TickTrader trading platform.
Every pattern and indicator has limitations that should be considered before using them in a trading strategy. The disadvantages of the Three Line Strike pattern are as follows:
High volatility periods can amplify the occurrence of false signals and erratic price movements, potentially leading to misguided trades. Conversely, during periods of low volatility, price action may be sluggish, and confirmations could be delayed. Therefore, it's important for traders to adapt their strategies accordingly.
Another important consideration is the possibility of false breakouts. Despite the apparent form of a Three Line Strike pattern, the pattern may provide continuation and reversal signals. This can deceive traders into entering premature trades, resulting in losses. Therefore, it’s important to wait for strong confirmation signals before committing to a trade.
The pattern’s signals vary across timeframes. On shorter intervals, noise can create deceptive setups. Conversely, on higher timeframes (daily or weekly), it might appear too infrequently to be actionable. Traders typically align the pattern’s timeframe with their strategy horizon.
Minor variations in candle size, wicks, and closes often lead to different interpretations of what qualifies as a valid pattern. This subjectivity can reduce consistency in automated strategies or when used by multiple analysts across a trading desk.
In illiquid instruments (thinly traded stocks, exotic currency pairs, or small-cap futures), candle formations may lack integrity due to wide spreads and irregular price gaps, making the 3 Line Strike unreliable or misleading.
The differences between the Three Line Strike pattern and the Three Black Crows/Three White Soldiers patterns lie in their trading formations and implications:
Aspect | Three Line Strike Pattern | Three Black Crows/Three White Soldiers |
Formation | Consists of four consecutive candlesticks, with the fourth candlestick completely engulfing the previous three. | Consists of three consecutive candlesticks with progressively lower (crows) or higher (soldiers) closing prices. |
Implication | Indicates either a trend continuation or a reversal in market sentiment, either from bullish to bearish or vice versa. | Reflects a strong momentum in the direction of the prevailing trend, suggesting a continuation of the trend rather than a reversal. |
The Three Line Strike is a complex candlestick pattern, as it can signal both trend continuation and potential reversal. Despite its intricacy, the formation appears relatively frequently on price charts, making it a useful component of technical analysis. Mastering price action chart reading takes time and experience; however, understanding patterns like the Three Line Strike can support traders in decision-making.
If you wish to integrate this or other analytical tools into your trading strategy, consider opening an FXOpen account to access hundreds of global markets with tight spreads and low commissions.
The Three Line Strike pattern consists of three consecutive up/down candles followed by a fourth long down/up candle that fully engulfs three candles in front. It’s believed to provide continuation signals, but it often appears before a trend reversal. So, traders confirm the pattern with additional analytical tools and following candles to determine the trend direction.
The Three Line Strike Strategy refers to the 3 Line Strike candlestick pattern. It’s based on the assumption that the pattern will be followed by either a reversal or a continuation of the trend. Traders often wait for the candlestick to close above/below the pattern for an entry point, place a take-profit order, considering the closest resistance/support levels, and a stop-loss level below/above the pattern based on the nearest support or resistance levels and significant swing points.

