TL;DR
Bitcoin trades down 50% from its all-time high, but on-chain data reveals a specific cohort accelerating purchases rather than retreating. CryptoQuant data shows accumulator addresses now acquire approximately 372,000 BTC per month — a 37x jump from roughly 10,000 BTC monthly in September 2024. The contrast highlights how dramatically long-term holder behavior shifted during the correction.
CryptoQuant’s strict filtering excludes exchange wallets and miner addresses, suggesting the data reflects genuine accumulation rather than operational movement. While short-term traders react to volatility, long-term participants absorb supply at aggressive rates.
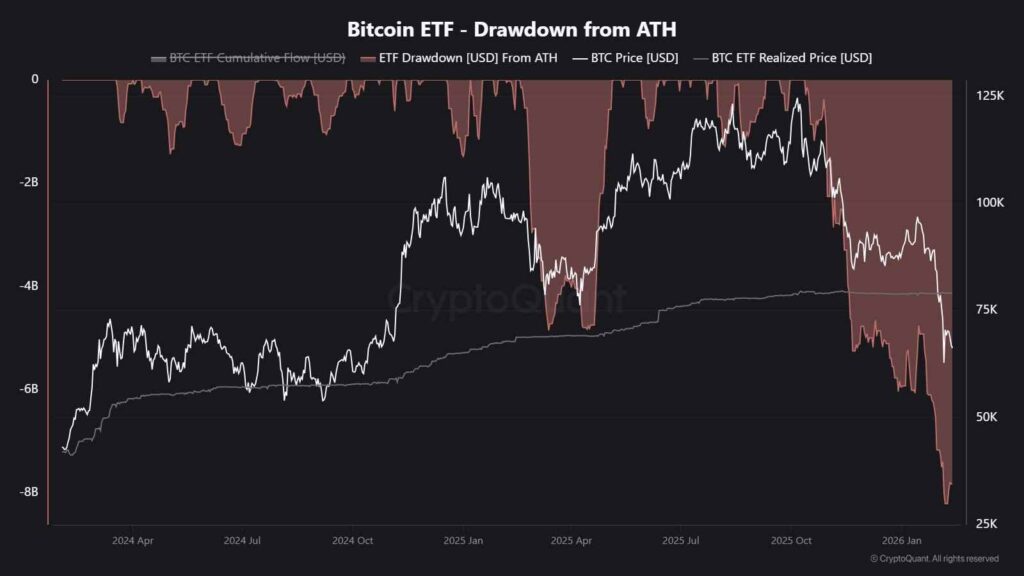
Spot Bitcoin ETF flows registered net outflows of $8.2 billion since the all-time high, marking the largest drawdown in the history of regulated Bitcoin products. The current price sits 17% below the average purchase price of ETF holders at approximately $79,000. The pressure comes from institutional capital exiting regulated vehicles, not retail panic. When institutional flows stabilize or reverse, regime shifts typically follow.
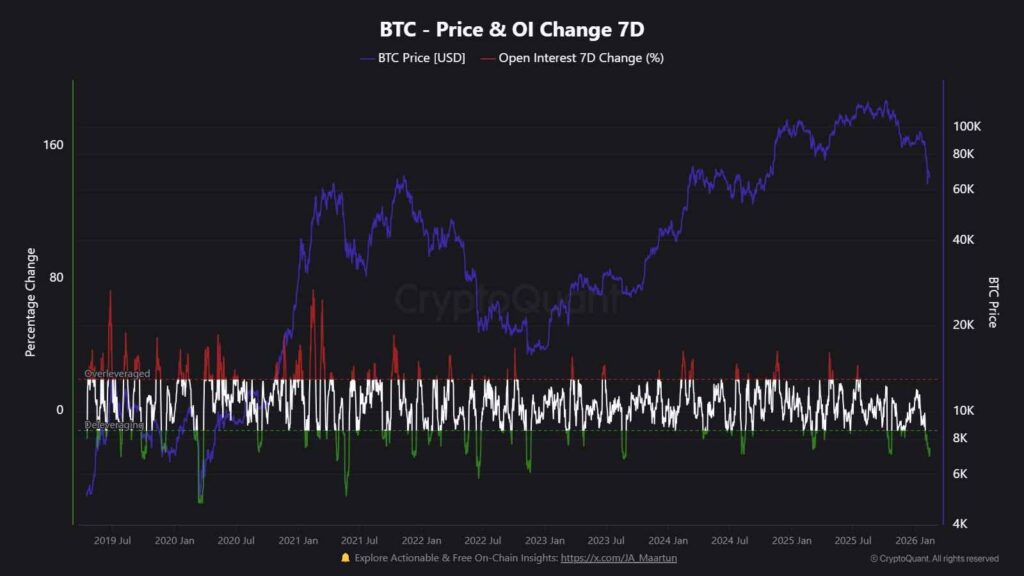
Open Interest (OI) in derivatives dropped from $45.5 billion to $21.7 billion, declining 27% in the past seven days alone. The aggressive deleveraging flushes over-extended speculative positions. Historically, major leverage cleanouts precede local or cycle bottoms by removing weak participants and reducing cascading liquidation risk.
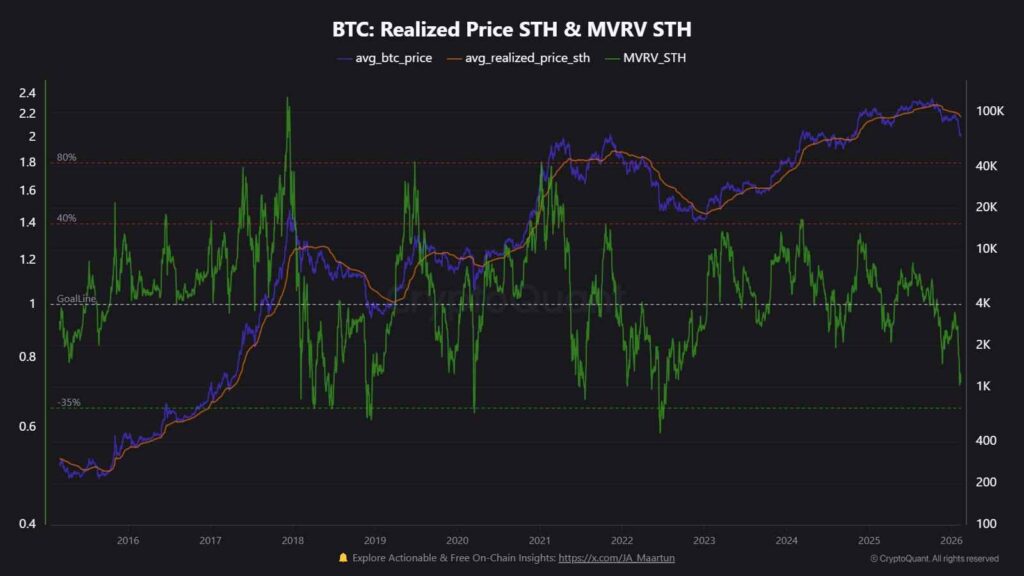
Short-Term Holder (STH) realized price stands at $92,458, placing the current STH MVRV ratio at 0.72 — meaning recent buyers hold average losses of 28%. The ratio reached its lowest level since July 2022, the previous bear market bottom. While MVRV can drop to 0.5-0.6 in extreme cycles, readings below 0.8 historically mark zones where risk/reward improves substantially for medium-to-long-term entries.
Price tests multiple support layers simultaneously: the previous all-time high zone, the upper range boundary, and a major support cluster. Similar structures marked cycle bottoms in previous phases. The alignment between on-chain data and price action increases the probability of strong reactions — either a bounce or final capitulation.
Analyst @JA_Maartun projected historical patterns from the April 2024 halving. The 2012 pattern (777 days) points to June 4, 2026. The 2016 pattern (889 days) suggests September 24, 2026. The 2020 pattern (925 days) indicates October 30, 2026. The most common historical window for cycle bottoms falls in September-November.
Why does a true Bitcoin bottom take time to form?
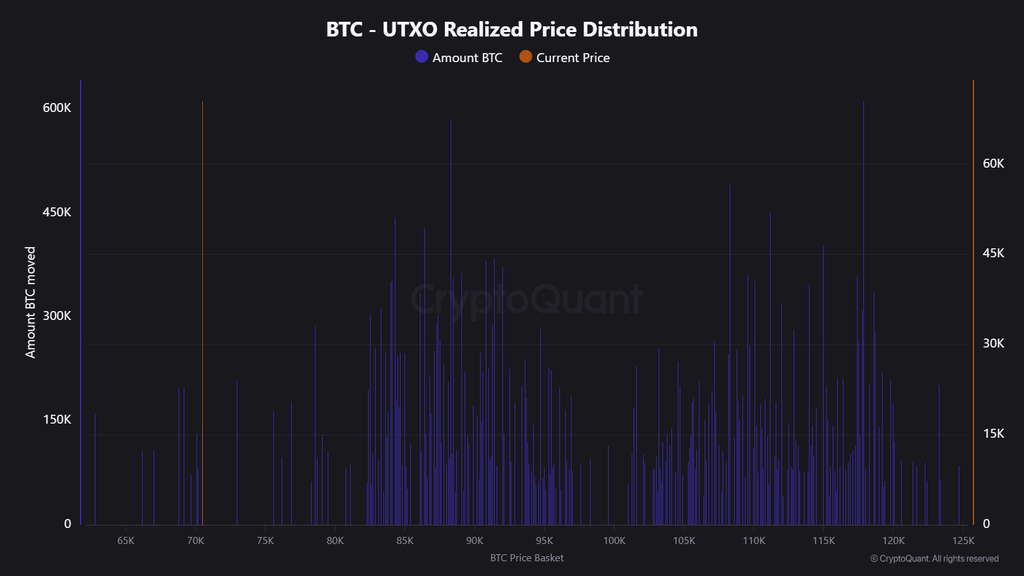
~9.31M $BTC — ≈46% of circulating supply — is sitting above the current price.
A large share of holders are waiting to sell at breakeven or a small profit.
That overhead supply must be absorbed and redistributed to stronger… https://t.co/x4SX61f3RD pic.twitter.com/oHDC44aM8z
— Maartunn (@JA_Maartun) February 15, 2026
Cycle bottoms require time, additional pain, and macro-sentiment alignment. The -50% drawdown hurts but remains within historical norms; previous cycles recorded -70% to -85% corrections. Current fear runs high but has not reached extremes.
The combination of leverage cleanup, deeply underwater short-term holders, institutional outflow pressure, and technical confluence suggests risk/reward improves, even if further downside tests the $55,000 realized price or $41,000 long-term holder cost basis.
The analysis does not declare an absolute bottom. It identifies conditions maturing toward improved entry zones while respecting that the final bottom likely requires several more months and possibly deeper pain before reversal conditions fully align.


