Bitcoin is holding inside a tight trading range between $60,000 and $73,000, but data shows the market structure is becoming increasingly fragile. The largest cryptocurrency by market cap dropped as much as 3.6% to $65,709 on Thursday before recovering slightly.
President Trump’s renewed aggressive stance toward Iran has rattled energy markets, with WTI crude oil surging past $111 a barrel. Bitcoin reacted, slipping roughly 2% over 24 hours to around $67,000.
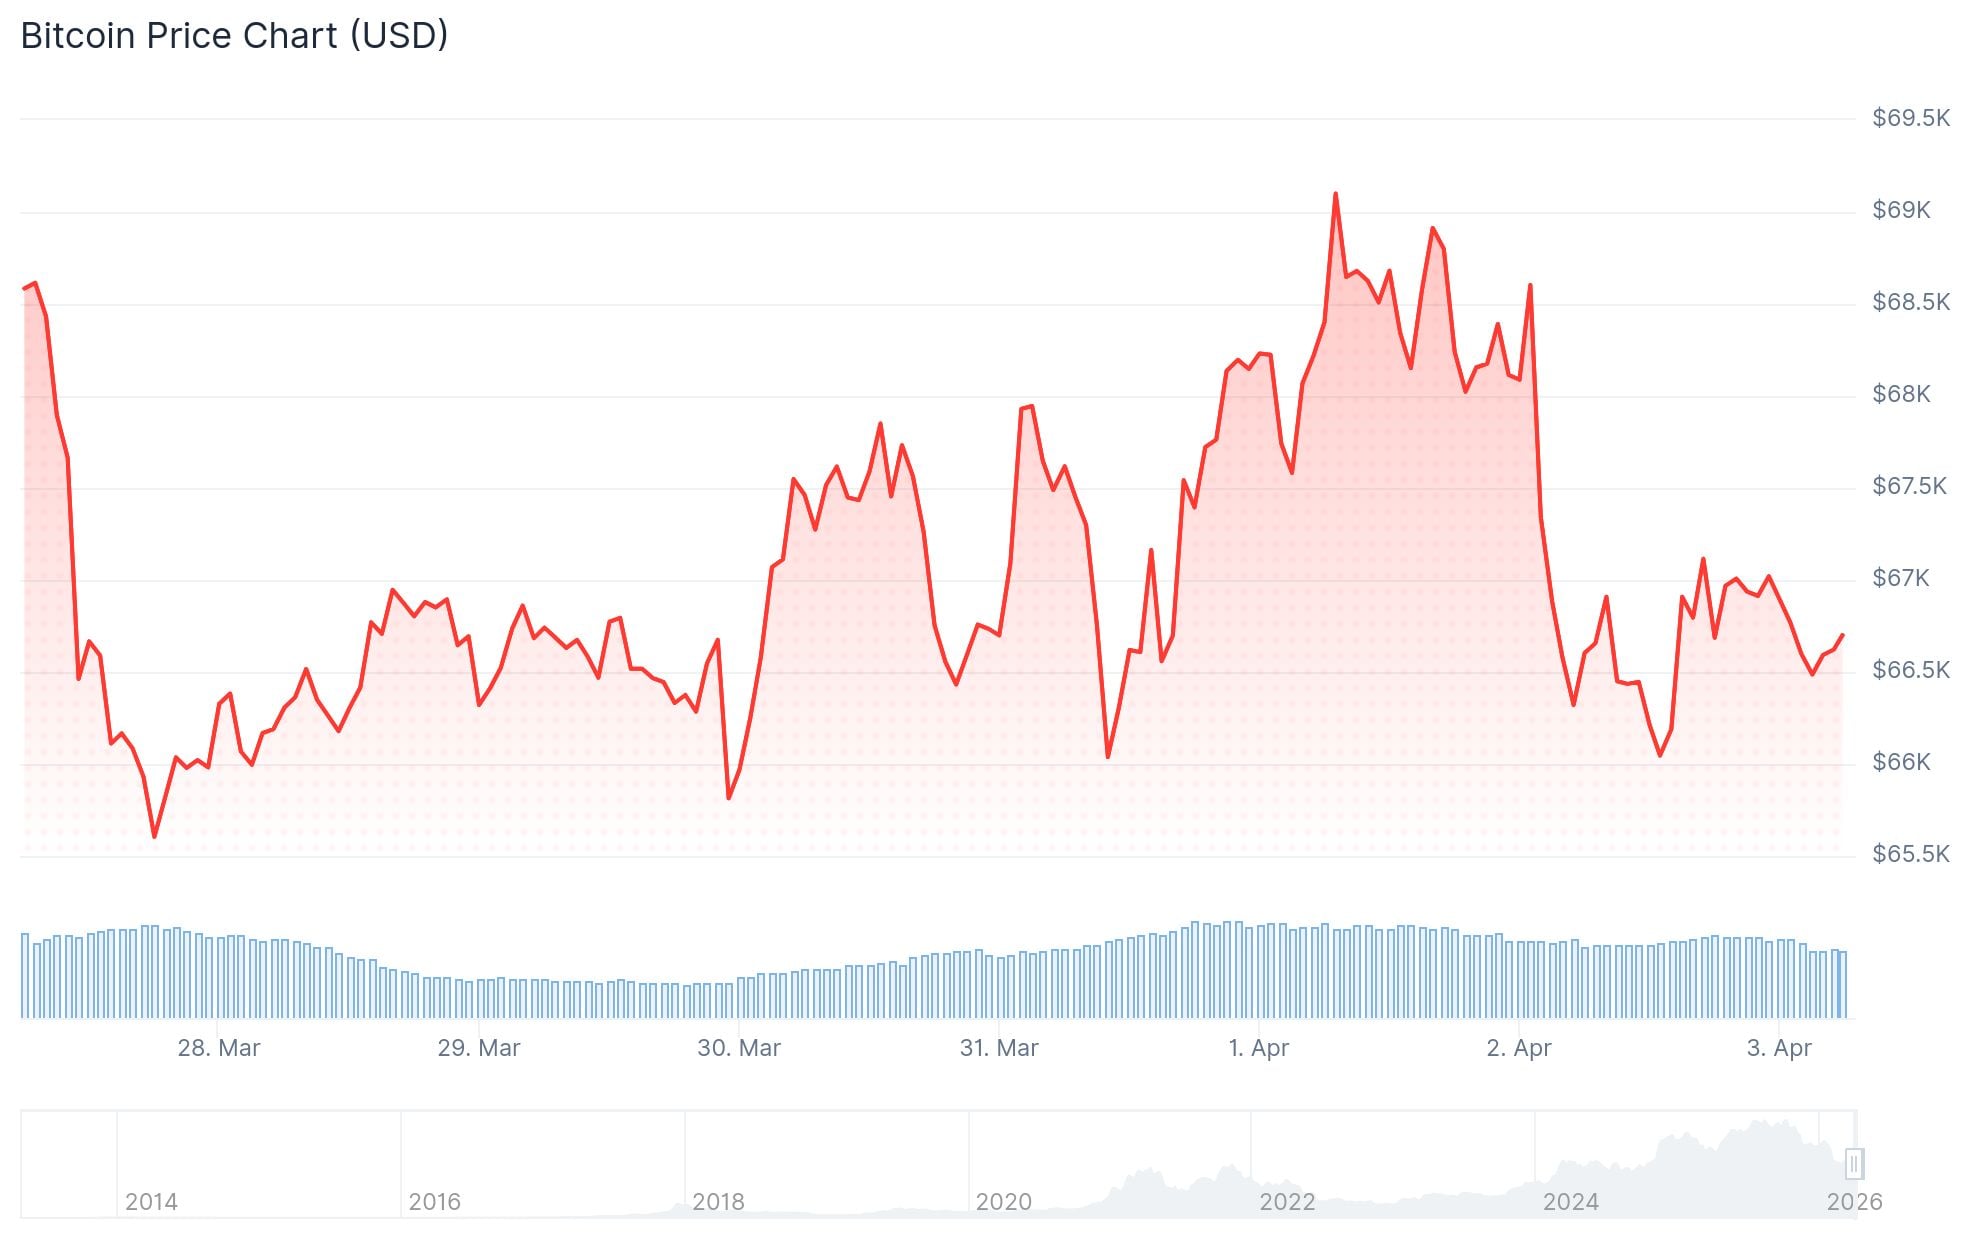
Alex Kuptsikevich, chief market analyst at FxPro, said: “Trump’s latest comments on the war with Iran triggered a sharp selloff amid a lack of de-escalation signs,” adding that Bitcoin is consolidating between $66,000 and $69,000.
Caroline Mauron, co-founder of Orbit Markets, noted: “Bitcoin is largely following stocks’ direction, though in the past few weeks it has showed reduced sensitivity to both good and bad news.”
Options data from Deribit and Glassnode shows a build-up of put options between $68,000 and the mid-$50,000s. This creates what traders call a “negative gamma” zone.

In simple terms: as prices fall below $68,000, market makers are forced to sell Bitcoin to hedge their own risk. That selling pushes prices lower, which triggers more selling — a feedback loop.
Glassnode stated in its weekly report: “A move into this zone could trigger accelerated selling as hedging flows reinforce downside momentum, turning what would otherwise be a gradual move into a sharper repricing, with a potential revisit of the $60K level.”
With liquidity still thin following the March 27 options expiry and Easter holidays approaching, there may not be enough buyers to absorb that pressure.
Chartered market technician Aksel Kibar has identified a bearish rising wedge pattern on Bitcoin’s chart. He stated: “Breakdown of the lower boundary will be the signal for a possible move toward $52,500.”
Stick to your discipline. https://t.co/dOu8aYYdLp pic.twitter.com/He1v0vQrJS
— Aksel Kibar, CMT (@TechCharts) April 2, 2026
Bitcoin’s aggregated open interest remains below $20 billion, a level last seen in early February when BTC traded near $79,000. Liquidation heatmap data from Hyblock shows heavy long positions at risk between $63,000 and $65,000.
Demand metrics are also weak. CryptoQuant reported that apparent demand was negative by about 63,000 tokens as of late March. Large holders have turned net sellers over the past year.
Jasper De Maere, a trader at Wintermute, summed it up: “Onchain data confirms what price action has been telegraphing: there’s zero conviction.”
US spot Bitcoin ETFs recorded $174 million in net outflows on Wednesday. March saw roughly $1.1 billion in net inflows, but those flows have proven sensitive to macro shifts.
Bitcoin is down 45% from its October peak of $126,000.
The post Bitcoin (BTC) Price: The Options Market Is Flashing a Warning Sign Bulls Can’t Ignore appeared first on CoinCentral.

