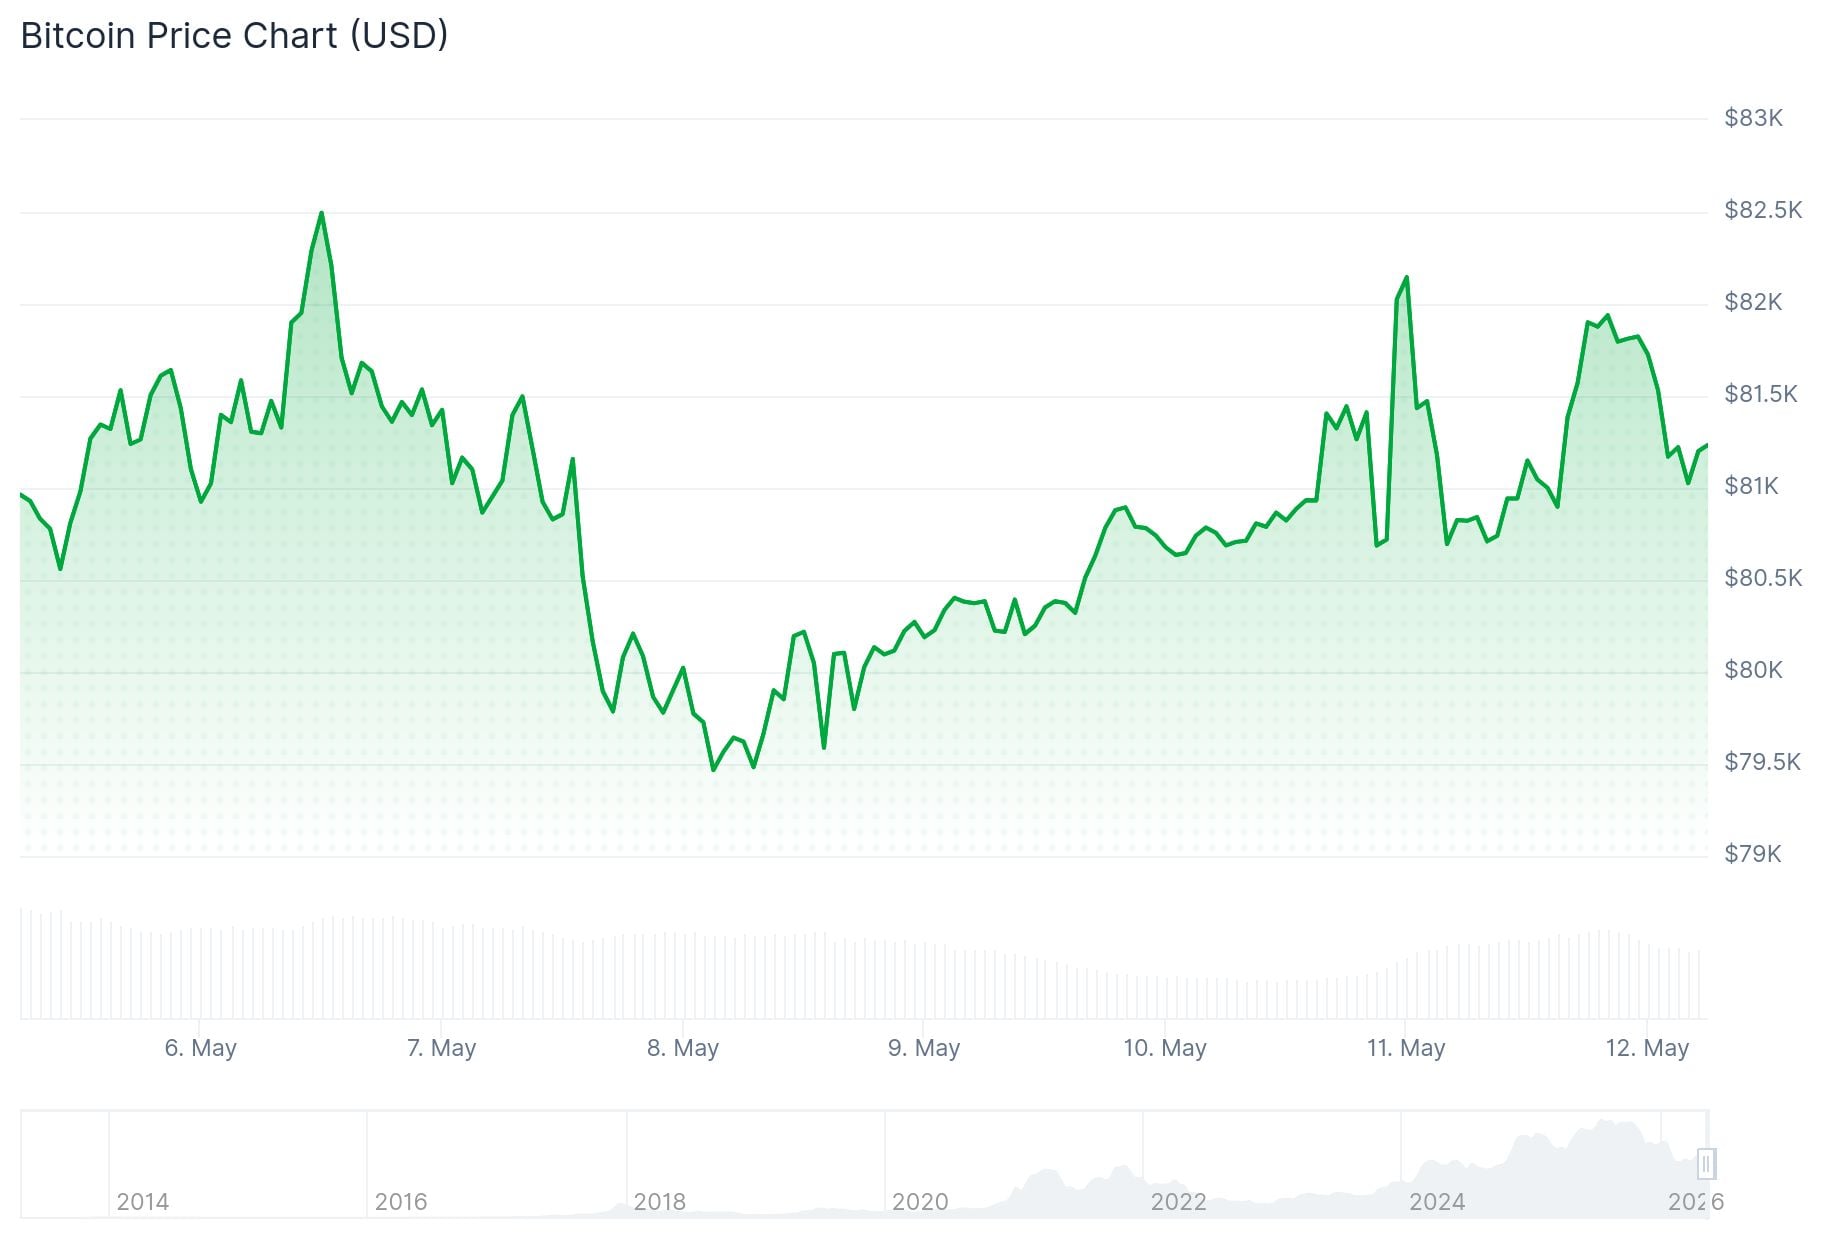
Bitcoin’s MVRV ratio is approaching a rare “golden cross” signal, while price action hovers around a key resistance level near $82,000.
The Market Value to Realized Value (MVRV) ratio measures whether Bitcoin is over or undervalued. CryptoQuant analyst CW8900 flagged that a golden cross between the MVRV ratio and its 200-day EMA is imminent. The analyst described it as “a representative trend reversal signal and is a bullish indicator.”
This signal has appeared twice before. After the 2022 cycle low, the first crossover preceded a 90% rally from $16,300 to $31,000. A second cross in September 2023 preceded a 400% run to the all-time high of $126,000 in October 2025.
CW8900 also noted that BTC’s 30-day SMA crossed above its 90-day SMA in late April, stating: “BTC has completely turned to a bullish trend.”
A golden cross between the $BTC MVRV Ratio and the 200D EMA line is imminent.
This signal is a representative trend reversal signal and is a bullish indicator.
A golden cross is about to occur again following the dead cross last August.
Another bullish signal for $BTC is… pic.twitter.com/13z6HvNiGA
— CW (@CW8900) May 10, 2026
Crypto analyst Daan Crypto Trades posted on X that Bitcoin had a “solid weekly close above the bull market support band,” adding that clearing the daily 200MA/EMA around $82K would be “a signal of strength for further continuation.”
$BTC Solid weekly close above the bull market support band.
If the bulls can sustain up here and clear the Daily 200MA/EMA at ~$82K then that'd be a signal of strength for further continuation. pic.twitter.com/4at1AicQQ3
— Daan Crypto Trades (@DaanCrypto) May 11, 2026
Meanwhile, SoSoValue noted in a post last week that BTC ETFs recorded $623 million in net inflows over the week, a sixth straight week of inflows. They described it as a “week of layered capital allocation” rather than a full risk-on move, with some short-term profit-taking observed alongside continued institutional positioning.
The key message from ETF flows last week: this was not a full risk-on week, but a week of layered capital allocation as macro conditions improved.$BTC ETFs recorded $623M in net inflows for the week, marking 6 straight weeks of inflows. That tells us institutional positioning… pic.twitter.com/WnOcq91K3m
— SoSoValue (@SoSoValueCrypto) May 11, 2026
Analyst Shib Spain noted that BTC broke above a multi-month downtrend line on the weekly chart, pointing to a MACD bullish reversal as confirmation. Analyst Moustache said the Bitcoin market cap RSI bounced off multi-year monthly support, stating: “Prices will go much, much higher.”
Bitcoin failed to hold above $81,500 and pulled back, currently trading above $80,500 and the 100-hour simple moving average. A contracting triangle pattern has formed on the hourly chart, with support at $80,800.
If BTC clears $81,800 and $82,000, the next resistance levels are $82,250, $82,500, and $83,500. On the downside, key support sits at $80,400, then $79,400, and $78,500.
The short-term holder (STH) cost basis “heated” band is at $92,000, and the “overheated” band sits at $104,000. Despite some profit-taking, on-chain data from Glassnode suggests price has room to push higher in the short term.
BTC ETF inflows of $623 million over the past week mark six consecutive weeks of positive institutional flows, with longer-term allocation capital remaining in place despite a two-day outflow streak at the end of last week.
The post Bitcoin (BTC) Price: A Rare Signal That’s Predicted Every Major BTC Rally Is Back appeared first on CoinCentral.

