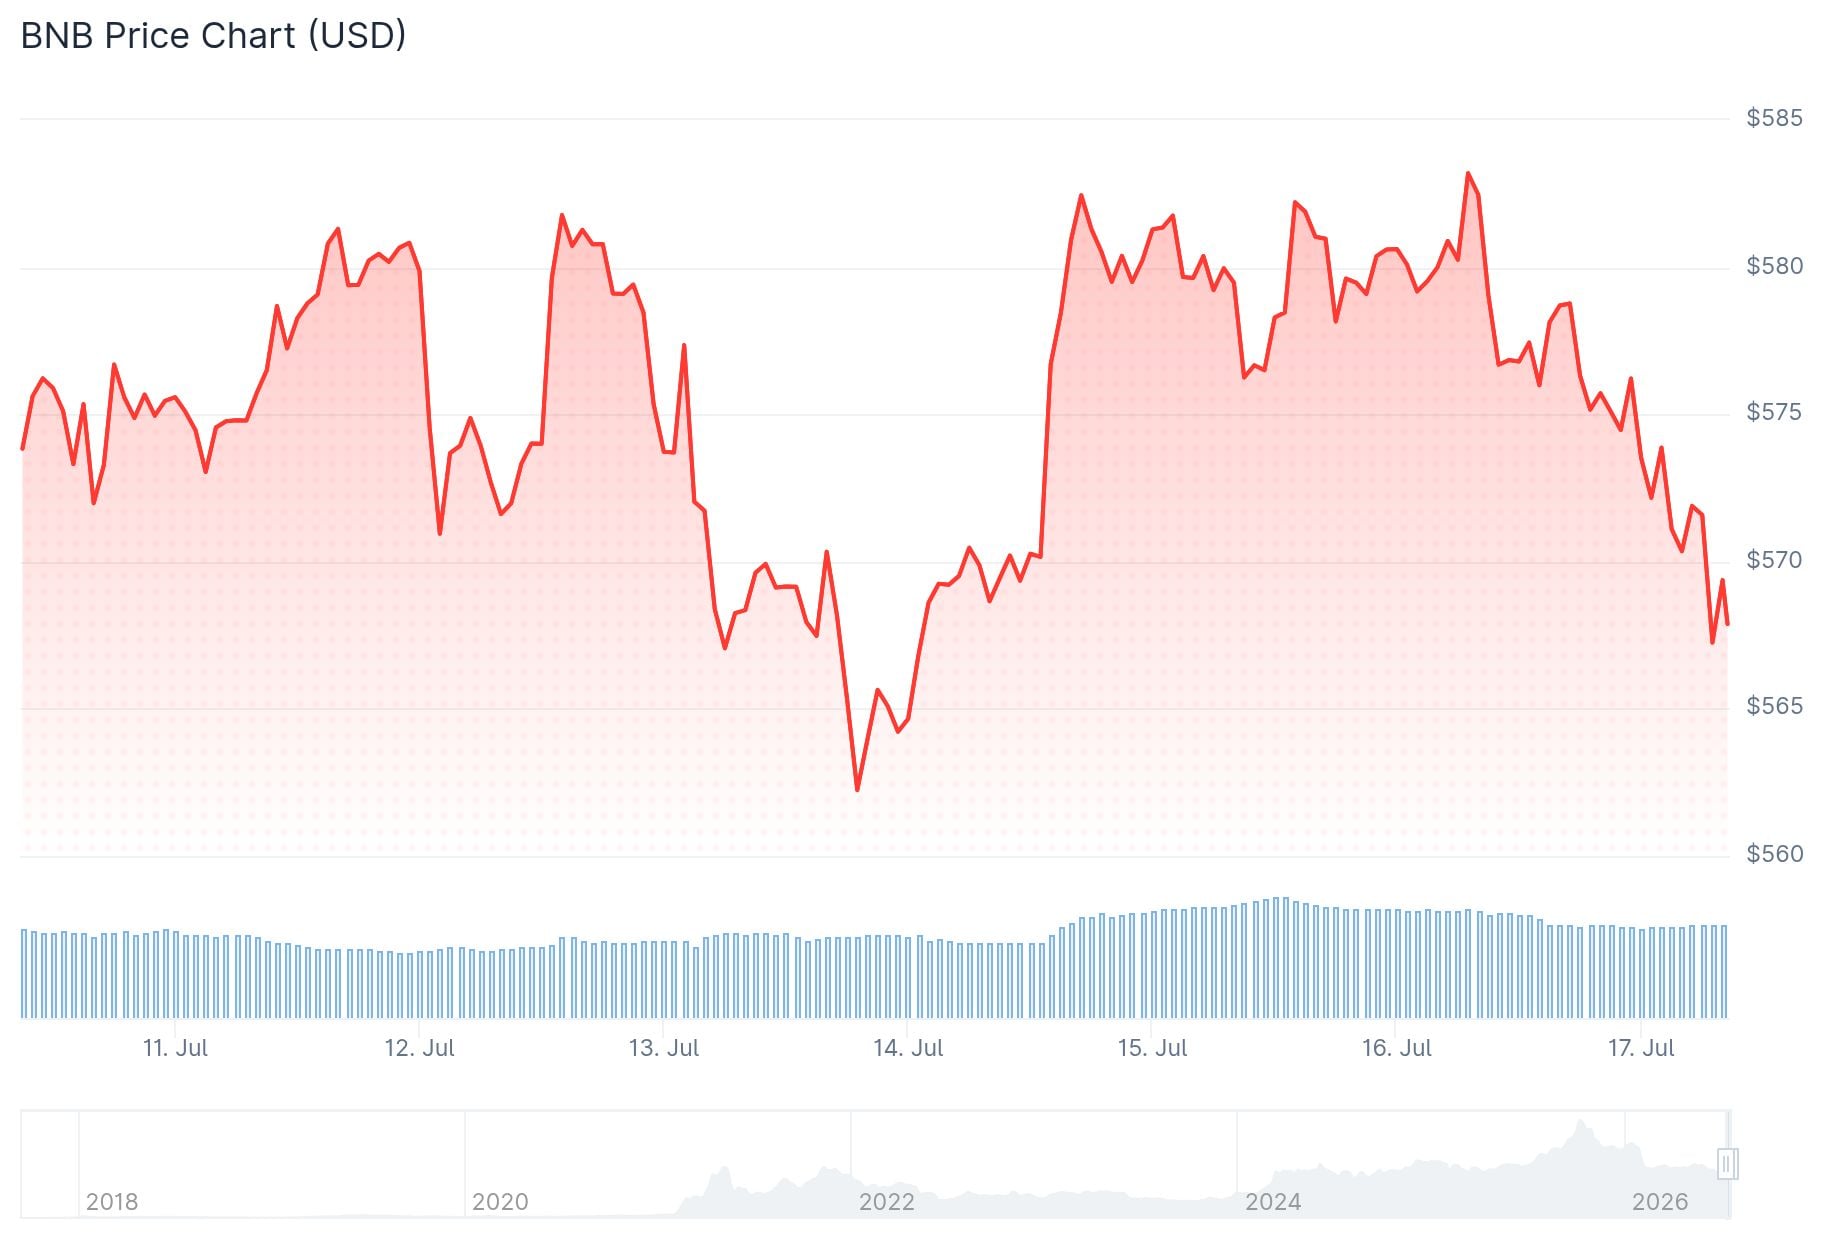
BNB is trading around $577 and building toward a technical breakout that could push prices to $647. Traders are watching a key resistance zone closely while fresh supply data adds to the bullish case.
The token has formed an inverse head-and-shoulders pattern on the 12-hour chart. This pattern typically signals a trend reversal after a period of decline. The neckline sits at $589–$590, and a clear break above it would set a measured price target of $647.29 — about 12% above current levels.
Over the past 24 hours, BNB traded in a narrow range between $574.69 and $584.24. That tight range shows that neither bulls nor bears have taken full control yet.
On the downside, $550 is a key support level, aligning with the 0.618 Fibonacci retracement and the Value Area Low. A drop below $537 would cancel the current bullish setup.
BNB Chain completed its 36th quarterly Auto-Burn, removing 1,615,827 BNB from circulation. At current prices, that burn was worth roughly $931.7 million.
BNB Chain Completes 36th Quarterly Burn, Removing 1.61M BNB
According to an official announcement, BNB Chain has completed its 36th quarterly BNB token burn, destroying 1,615,827.795 BNB worth approximately $932 million at the time of the burn. Following the burn, BNB’s total… pic.twitter.com/qZDtlBdus2
— Wu Blockchain (@WuBlockchain) July 15, 2026
Total BNB supply now stands at around 133.17 million tokens. The long-term target is to reduce supply from the original 200 million down to 100 million. Each burn uses an automated formula based on BNB’s price and block production on BNB Smart Chain.
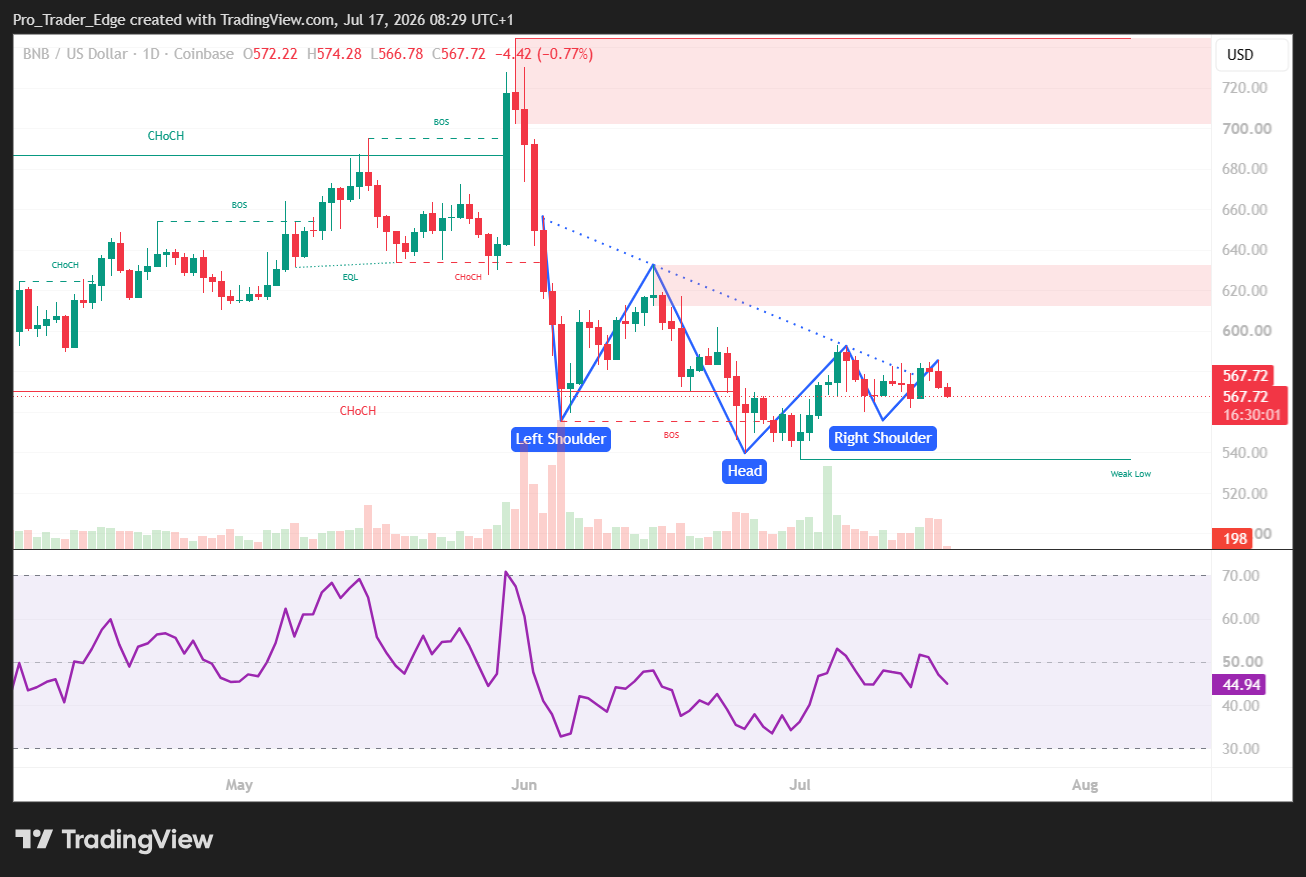
Crypto analyst BATMAN highlighted the recent price action on X, noting that BNB broke a bearish trendline and successfully retested it. He said a higher high “should be imminent,” pointing to the clean technical setup forming in the chart.
What a clean price action from $BNB.
Broke the bearish trendline and retest back to it successfully.
A higher high should be imminent. pic.twitter.com/PHTQIobrLa
— BATMAN ⚡ (@CryptosBatman) July 16, 2026
The RSI has struggled to break above the 59 level, failing five times in recent weeks. That makes the $580 zone a hard ceiling for now.
Liquidation data from Coinglass shows equal long and short leverage of $14.83 million each around the $570–$580 zone, pointing to a tug-of-war between buyers and sellers.
BNB Chain also rolled out a gas fee waiver running through the end of July. Lower fees could boost trading volume and on-chain activity.
Stablecoin market cap on BNB Chain has exceeded $17.8 billion. Total value locked (TVL) on the network climbed to nearly $5 billion.
Binance Pay now supports over 21 million merchants. The bStocks tokenized product hit $100 million in trading volume within 15 days, with 47% of volume occurring outside US market hours.
BNB serves as the native asset across BNB Smart Chain, opBNB, and BNB Greenfield, used for fees, staking, governance, and decentralized applications.
The post Binance Coin (BNB) Price: BNB Chart Turns Bullish After Biggest Quarterly Burn Yet — Here’s the Target appeared first on CoinCentral.





