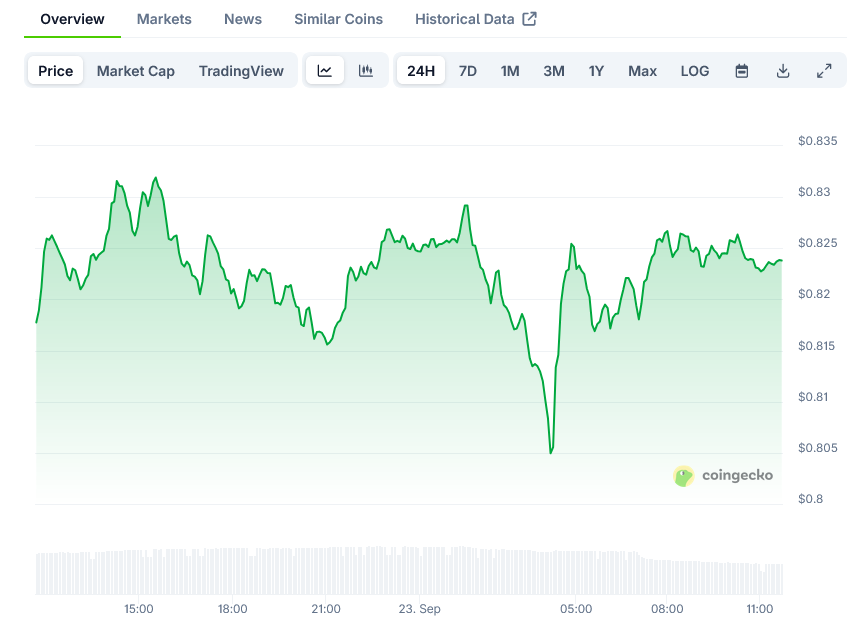
Cardano (ADA) is experiencing downward price pressure amid significant whale selling and increased dormant wallet activity. The cryptocurrency is currently trading below $0.82, having broken beneath its ascending trendline that had been in place since early July. This technical breakdown suggests a deeper correction could be underway in the short term.
Recent on-chain data reveals concerning trends for ADA holders. Santiment’s Age Consumed index shows spikes that historically precede price declines for Cardano. These spikes indicate dormant tokens—those stored in wallets for extended periods—are now moving, often transferred to exchanges where they create selling pressure.
The movement of these previously inactive wallets aligns with data from CryptoQuant showing the Taker Cumulative Volume Delta (CVD) for Cardano turned negative in mid-August. This metric, which measures the difference between market buy and sell volumes over a three-month period, has been steadily decreasing since then.
In just four days, whale addresses holding between 1 million and 10 million ADA sold over 560 million tokens, worth approximately $500 million. This massive sell-off reflects growing impatience among large holders who appear unwilling to wait for gradual price increases.
The daily chart for Cardano shows it closed below the daily support at $0.84 after Monday’s 6.1% decline. Technical indicators add to the bearish outlook, with the Relative Strength Index (RSI) reading 40—below its neutral level of 50—and the Moving Average Convergence Divergence (MACD) displaying a bearish crossover.
If ADA continues its downward movement, it could test the 50% price retracement level at $0.76, calculated from the June low of $0.51 to the August high of $1.02. This represents a key support zone that bulls will likely defend.
Despite the current bearish pressure, Cardano has demonstrated resilience by maintaining support above $0.88. This suggests retail investors are stepping in to absorb selling pressure from whales, preventing a deeper breakdown in price.
Chart analysis reveals an ascending triangle pattern forming on the daily timeframe. This pattern, characterized by higher lows converging below resistance at $0.95, typically signals increasing buying pressure. A breakout above this resistance level could open a path toward the $1.20-$1.25 range.

Additional technical factors support this potential bullish scenario. ADA currently trades below the upper Bollinger Band, indicating room for upward movement. The Supertrend indicator has already flipped bullish, and the RSI has recovered from oversold conditions, showing improving momentum.
For the bullish case to materialize, ADA must first reclaim the $0.84 resistance level. More importantly, a decisive break above $0.95 would likely trigger the projected rally toward $1.20-$1.25, with the $0.99 level serving as a key confirmation point.
The token’s current trading patterns align with Cardano’s historical behavior. ADA has often lagged behind peers during broader market rallies but later staged sharp comebacks, sometimes delivering 200-300% gains within a month once momentum shifts in its favor.
At the time of writing, Cardano trades at $0.81, continuing its correction after breaking below the ascending trendline. Active addresses remain low, indicating reduced on-chain participation, which typically limits sustained price growth.
If ADA loses its $0.880 support, it could drop to $0.837, potentially triggering additional selling and delaying recovery efforts.
The current price action represents the ongoing struggle between whale selling and retail buying, creating a pivotal moment for Cardano’s short-term price direction.
The post Cardano (ADA) Price: Whales Sell $500 Million Worth as Token Trades Below $0.82 appeared first on Blockonomi.
Also read: Solana (SOL) Price: $836M Whale Transfers Signal Possible $200 Support Test