Chainlink (LINK) is trading around $11.57, down 1.36% in the past 24 hours. The daily trading range sits between $11.46 and $11.80, with a market cap of $8.65 billion and reported volume of $307.47 million.
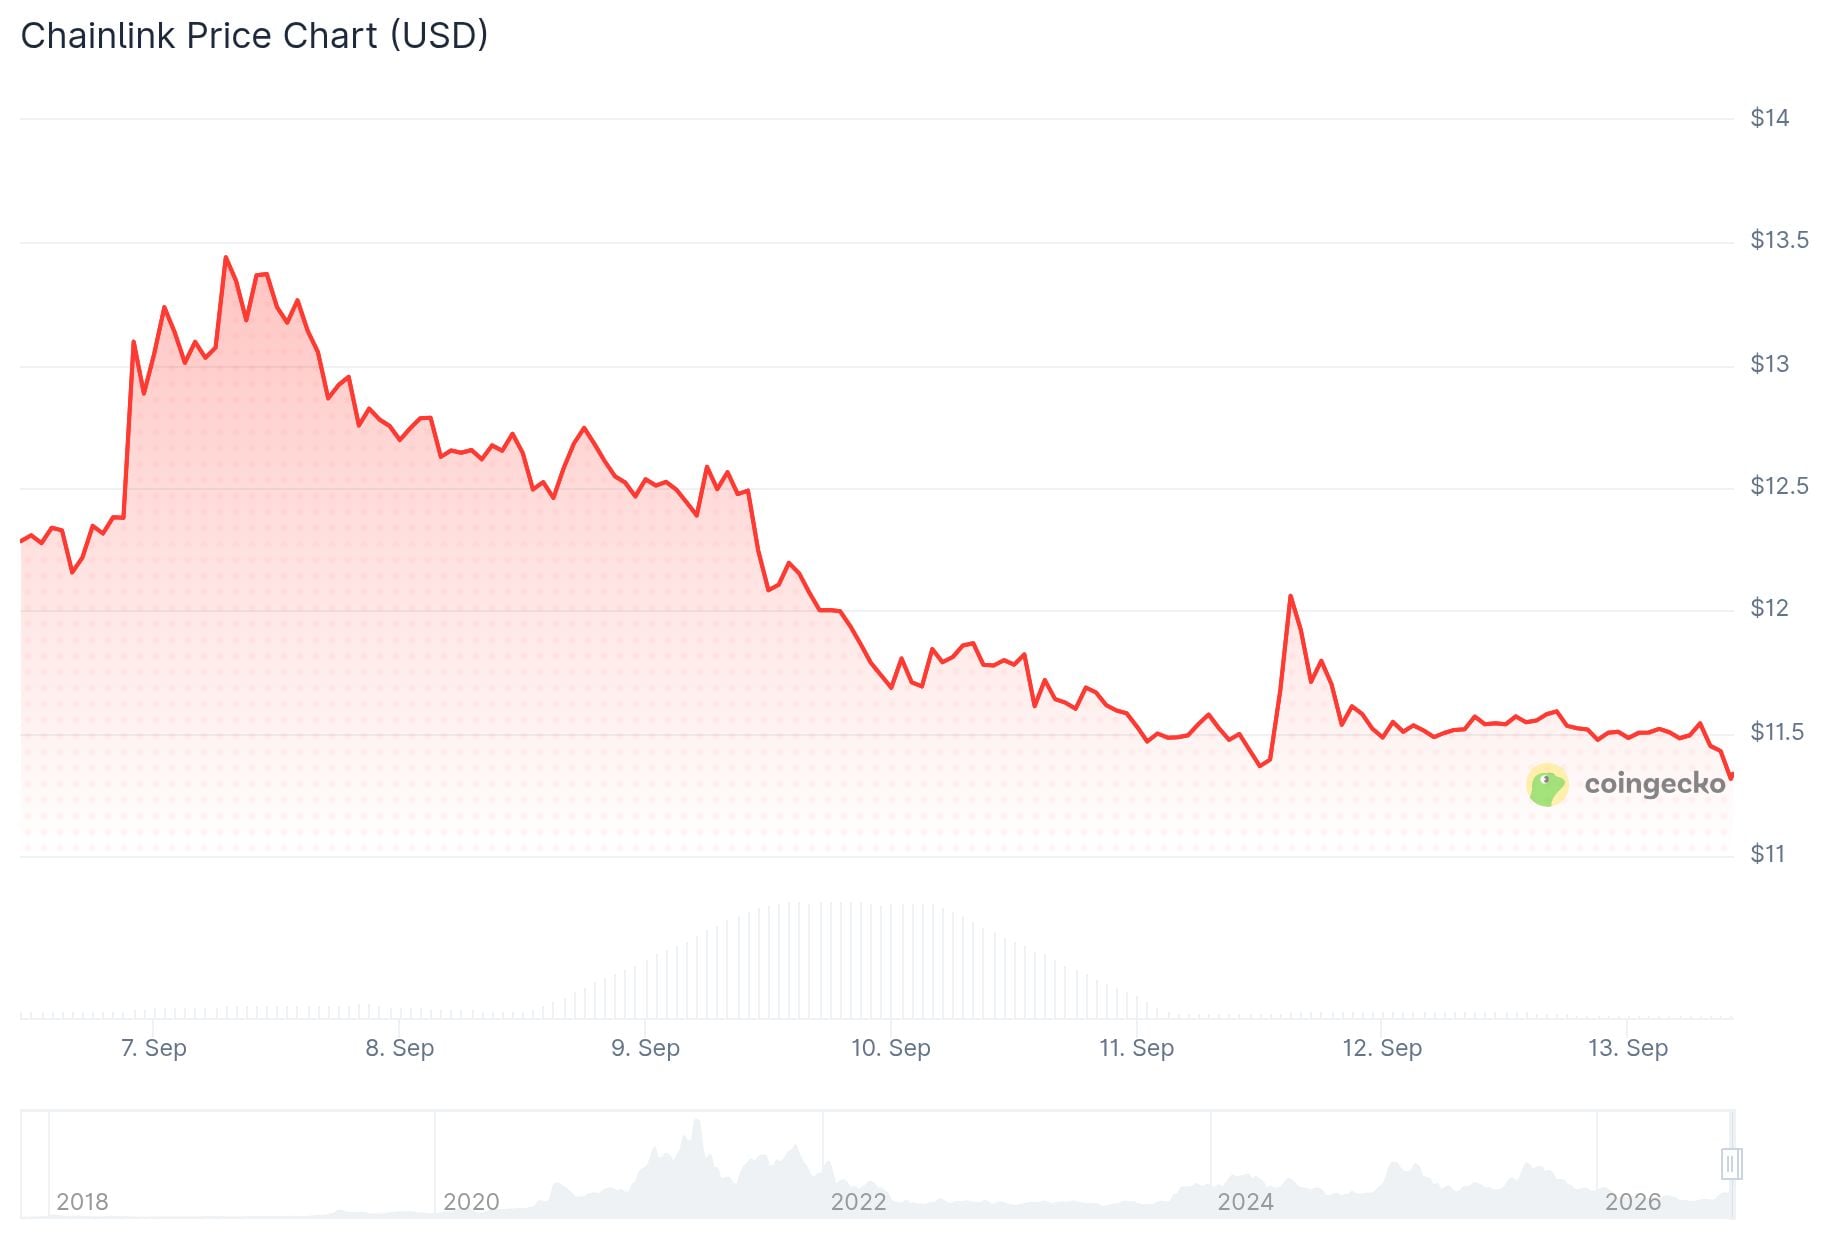
LINK has gained 35% over the past 30 days, drawing attention from both retail and institutional investors. The token still trades 78.05% below its all-time high of $52.70 set in May 2021.
Analyst Ali Charts flagged on X that whales appear to have bought the dip following a 17% correction from $13.68 to $11.29. Over 96 hours, large entities accumulated roughly 10.36 million LINK tokens, worth around $120 million. Ali Charts noted this type of accumulation after a sharp pullback suggests whales may be positioning for a rebound.
CHAINLINK: WHALES BUY THE DIP
Following Chainlink’s recent 17% correction from $13.68 to $11.29, whales appear to have taken advantage of the weakness.
Over the past 96 hours, large entities accumulated roughly 10.36 million $LINK, worth around $120 million.
That kind of… https://t.co/atynpETYPJ pic.twitter.com/hHqxkWMYj7
— Ali Charts (@alicharts) September 13, 2026
Chainlink ETFs saw a positive turn in early September. Bitwise’s CLNK and Grayscale’s GLNK pulled in $1.09 million and $4.27 million on September 9 and 10, respectively. Net inflows on September 11 were zero for both funds.
Combined lifetime inflows for both ETFs now total $151.76 million. Total net assets stand at $181.83 million, representing roughly 2.10% of Chainlink’s market cap.
Grayscale’s GLNK remains the larger product with $135.88 million in assets. Bitwise’s CLNK holds $45.95 million.
On the technical side, $11.46 is the most recent confirmed support. Resistance sits between $11.57 and $11.60, with $11.80 the next level above that.
The MACD histogram shows a slight positive reading of 0.011, suggesting bearish momentum is easing. The RSI sits at 38.65, above the oversold zone but not yet showing strong buying pressure.
A four-hour close above $12 would be the first confirmation signal. That could reopen the path to the $13.30 swing high. A break above that would shift focus to $14, and then the $15 target — roughly 29% above current levels.
LINK/BTC $LINK is a beast https://t.co/UBF7PAlDkp pic.twitter.com/Uv6200UzWE
— Moe (@Crypto_Moe84) September 12, 2026
Analyst Moe flagged a LINK/BTC chart showing the pair is compressing within a long-term descending structure. The pair is near a demand zone that could act as a pivot point, though no breakout has been confirmed.
The Chaikin Money Flow reading stands at -0.39, indicating more selling volume than buying during the measured period. LINK needs to reclaim $11.55 and $11.60 to improve short-term momentum.
The post Chainlink (LINK) Price: Big Money Is Accumulating LINK — Here’s What the Charts Say appeared first on CoinCentral.





