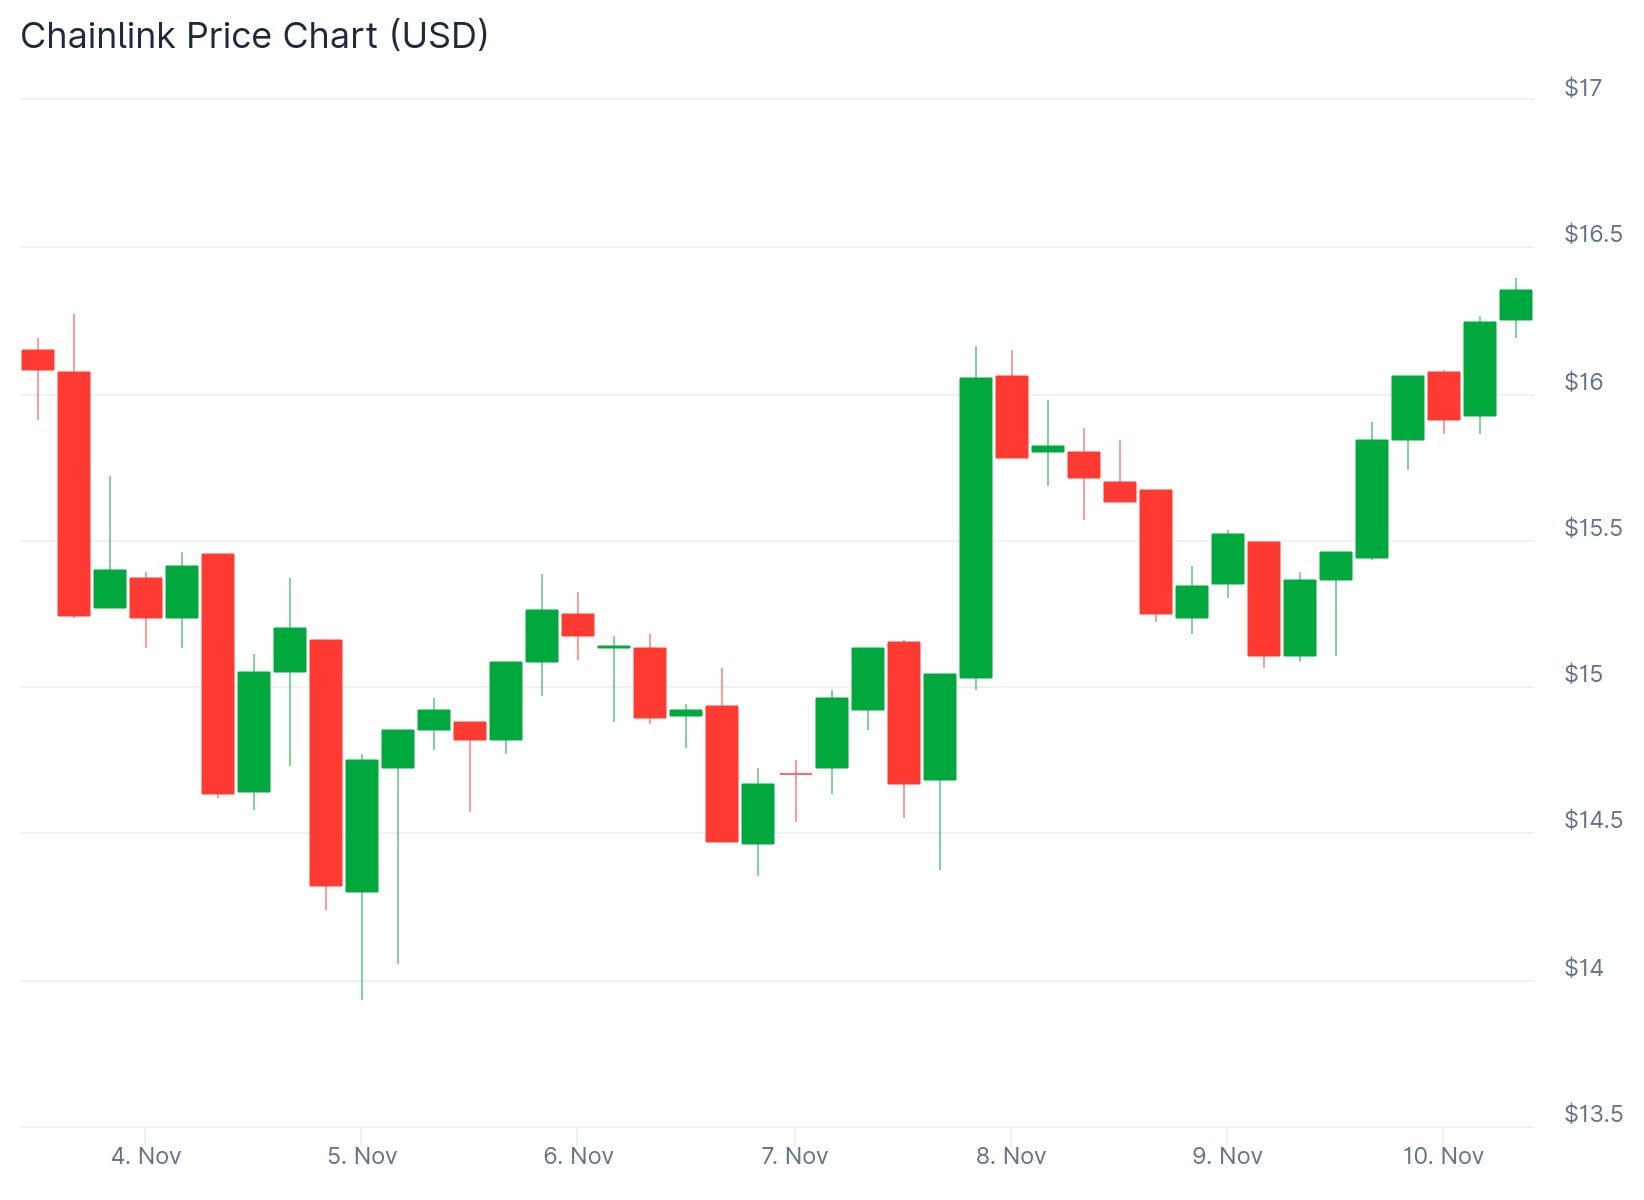
Chainlink is trading near $15.13 following a 3.91% daily decline. The price opened around $15.70 before facing selling pressure that pushed it to the $15.00 region.
Despite the recent drop, trading volume remains strong at $649.7 million. This shows active participation among traders and investors.
Analysts James Easton and Ali have both identified technical patterns suggesting a major breakout could be ahead. Their analysis focuses on a multi-year symmetrical triangle formation that has been developing since 2020.
The pattern shows a tightening price range between an ascending support line and a descending resistance trendline. Chainlink is currently positioned around the midpoint of this setup after bouncing from support between $12 and $13.
Chainlink $LINK has reached a crucial support trendline that could act as a launchpad for a move to $26 or even $47. pic.twitter.com/TeuYDlyDwR
— Ali (@ali_charts) November 8, 2025
Easton’s technical outlook indicates the token is approaching the end of its consolidation phase. His projection shows potential upward movement initially toward $30 to $35, and possibly beyond $50 if the price closes above the long-term resistance trendline.
Trader Ali Martinez reported whale buying activity on November 7. Large holders accumulated over 4 million LINK tokens during the two weeks ending that date.
Whales have accumulated more than 4 million Chainlink $LINK over the past two weeks! pic.twitter.com/CdFg1EdJLj
— Ali (@ali_charts) November 7, 2025
The accumulation happened while LINK’s price held relatively steady around $14. The token count held by addresses with 100,000 to 1 million tokens climbed sharply during this period.
This buying pattern indicates whales built positions during suppressed volatility. The purchasing intensified as LINK consolidated near multi-month lows.
Ali’s technical chart places the current trading zone around $14.70. This aligns with the 0.618 Fibonacci retracement level, a region often associated with strong reversals in price cycles.
His forecast includes two major upside targets once a confirmed rebound begins. The first target sits at $26, followed by a potential extension toward $47.
The projected path shows gradual price recovery through $16 and $20. This would lead to a retest of the $28 resistance zone.
A successful breakout above that level could open the path to the next rally phase near $47. This would complete the upper trendline projection shown in his model.
Chainlink maintains a market capitalization of $10.55 billion. This places it within the top twenty digital assets by value.
The asset is currently trading around the ascending support trendline that has historically acted as a foundation for previous rallies. This support has held multiple times since 2020.
The short-term chart shows a descending trendline, indicating reduced momentum after the latest accumulation phase. The token’s failure to hold above $15.50 to $15.60 shows short-term traders are taking profits at local highs.
A move below $15.00 could open the door to the next support near $14.70. Stability above this level could signal the start of a new consolidation range before recovery attempts resume.
Trader Lucky identified a potential breakout setup projecting LINK could reach $30 if the token breaks through descending channel resistance. The analysis highlighted two previous breakout attempts from similar demand zones that preceded uptrends.
$LINK is linking for new move, IMO. pic.twitter.com/oko0jCgzJ6
— Lucky (@LLuciano_BTC) November 7, 2025
Lucky identified a demand zone between $12 and $15 where buying pressure has historically triggered rallies. A breakout above the upper trendline projects a measured move toward $30.94, representing potential upside of more than 110% from current levels.
Trader Solberg Invest suggested LINK could first test support between $10 and $12 before beginning an upward trajectory toward $30. The weekly chart displayed a descending resistance trendline that has capped rallies for over two years.
$LINK looks good! pic.twitter.com/krBcyeIWAC
— Solberg Invest (@SolbergInvest) November 6, 2025
Solberg’s analysis marked a consolidation range where LINK might accumulate before attempting to break long-term resistance. The chart projected two potential scenarios: an immediate breakout toward $33, or a retest of the lower support band before launching higher.
Trader DonaldsTrades confirmed an active LINK position on November 7. The eight-hour chart showed LINK breaking above a descending trendline that had pressured the token since August.
DonaldsTrades projected a measured move toward $33 if LINK successfully held support near current levels and cleared resistance around $18. The chart indicated LINK had already broken initial resistance.
On-chain data indicates recent whale accumulation remains intact. This supports the view that current selling pressure may be corrective rather than a structural reversal.
At press time, Chainlink trades at $15.44, up 4.7% over the past 24 hours.
The post Chainlink (LINK) Price: Analysts Project $50 Rally as Whales Accumulate 4 Million Tokens appeared first on CoinCentral.

