Dogecoin has posted a solid weekly gain of around 8.56%, pushing its price to roughly $0.08974 according to CoinMarketCap data. The token climbed from a low of around $0.08 on September 2 before recovering steadily through the week.
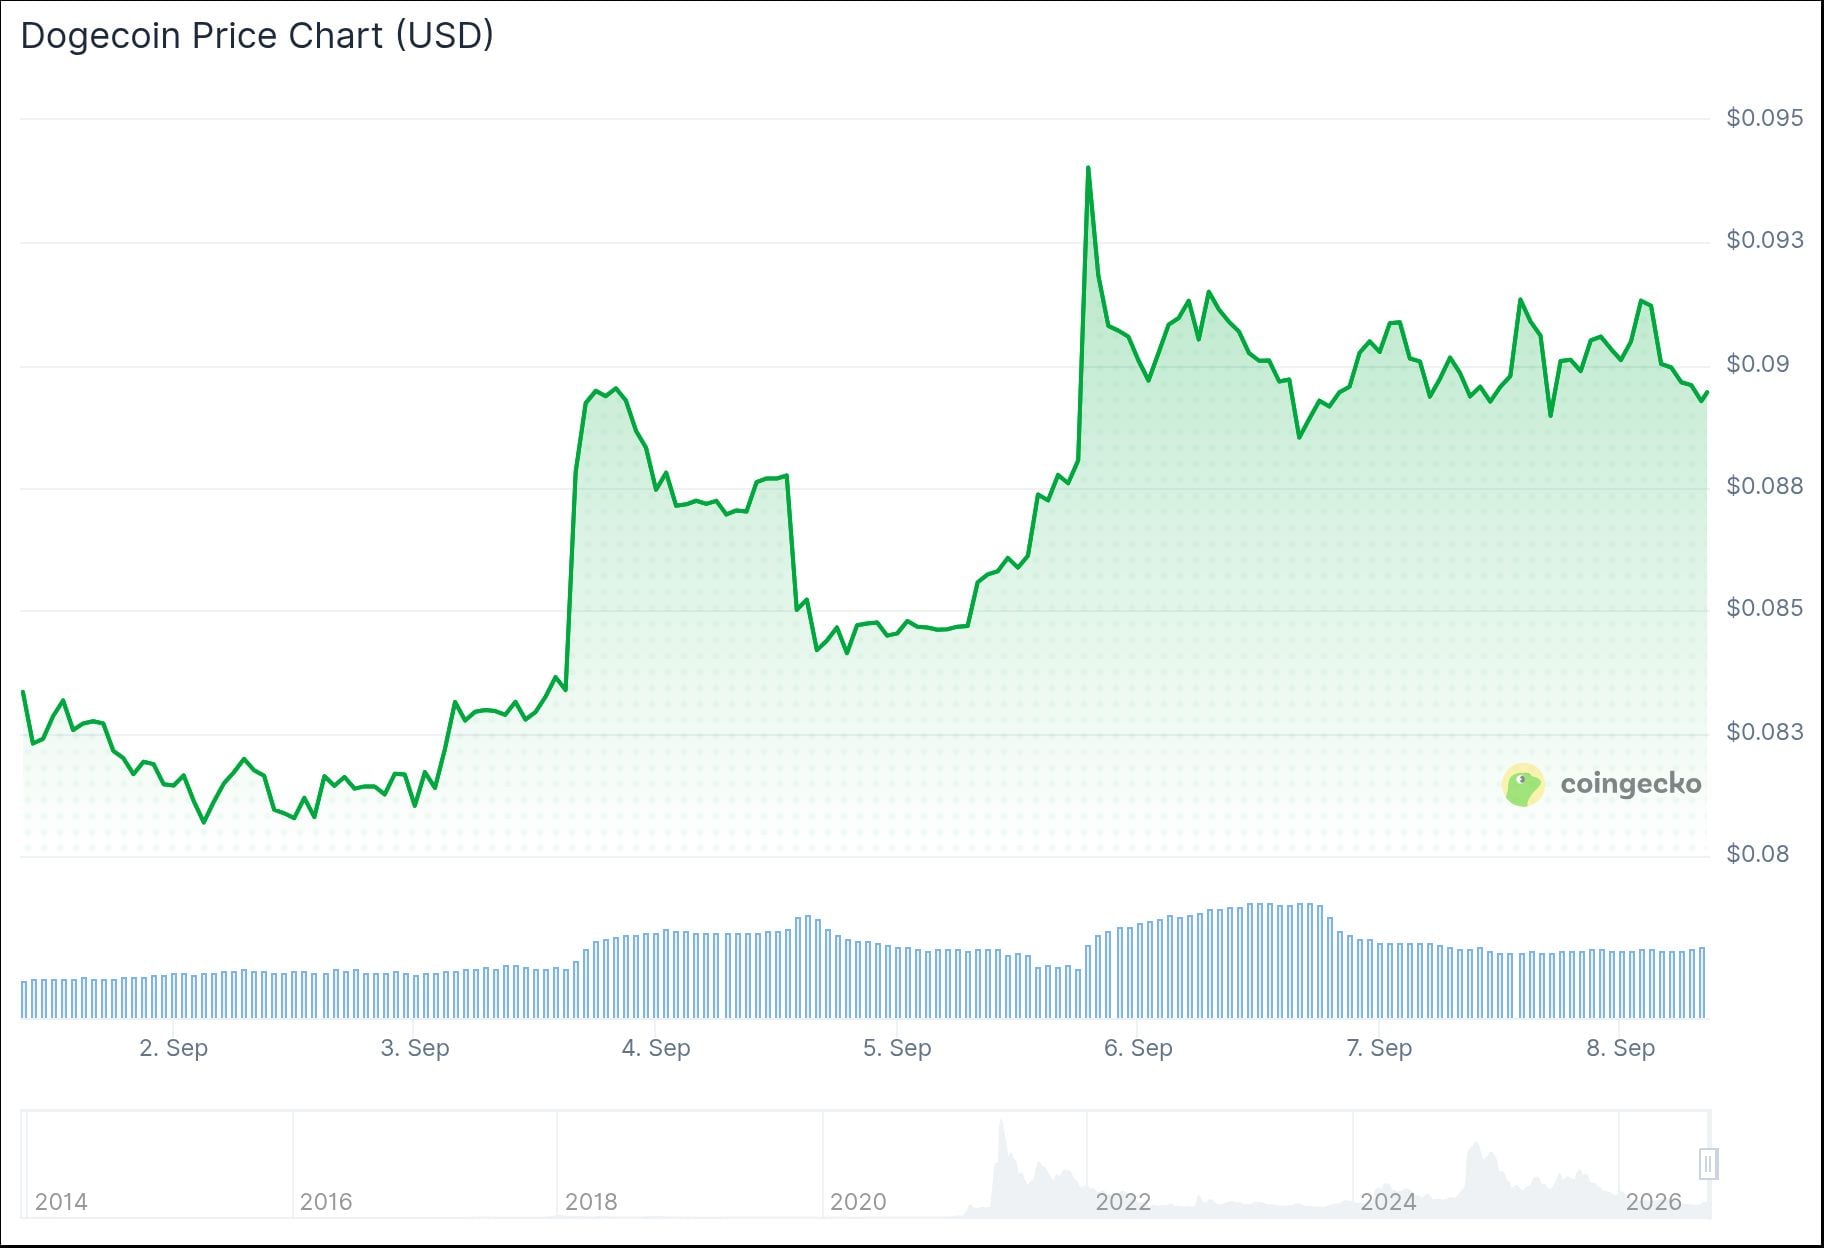
The first attempt to push above the 200-day moving average on September 3 failed, with DOGE reaching $0.089 before pulling back. The bigger move came on Saturday, when the token climbed from about $0.084 to nearly $0.095.
After reaching that high, DOGE pulled back to around $0.0887 early Sunday. The token was later holding near $0.088 as it tried to stay above the 200-day moving average.
Dogecoin’s market cap sits at about $15.39 billion, with 24-hour trading volume near $904.6 million. The weekly gain puts DOGE ahead of several other major meme tokens, including Shiba Inu at 7.81%, Bonk at 5.95%, and Pepe at 0.81%.
Trader Tardigrade pointed out that DOGE tested the 0.618 Fibonacci level multiple times and held it as support around $0.081. The token did not break below that zone before bouncing, giving the price a clearer short-term base to build from.
$DOGE/4-hour#Dogecoin has formed a Bullish Pennant — one of the most reliable continuation patterns in technical analysis.
📊 Compression complete
📈 Trendlines converging
🚀 Breakout imminent✍️ Bullish Pennants signal strong momentum continuation. The setup is textbook and… pic.twitter.com/CDCkzuGPu2
— Trader Tardigrade 🧬 (@TATrader_Alan) September 7, 2026
Technical analyst Trader Tardigrade also flagged that DOGE has formed a Bullish Pennant on the 4-hour chart, describing trendlines converging and compression complete. He called it a textbook setup with a breakout appearing close.
Community member Krisspax also noted Saturday’s move and the pullback that followed, asking whether DOGE could make another run at $0.10. The ten-cent level stopped Dogecoin’s rally in mid-August, making it a key test for the current recovery.
Technical analyst Ali Charts identified a bullish flag pattern on lower timeframes, projecting a possible move toward $0.12 if the breakout holds. Ali also pointed to a morning doji star on the daily chart, a pattern that can appear near the end of a decline.
DOGECOIN BREAKOUT CONFIRMED$DOGE appears to have confirmed a breakout from a bullish flag on the lower timeframes.
The pattern projects a move toward $0.12, while also aligning with multiple bullish signals developing on the higher timeframes. https://t.co/mICrWY7D1K pic.twitter.com/iWTmj98rmR
— Ali Charts (@alicharts) September 4, 2026
Key support is placed at $0.0813. Price targets being watched include $0.095, $0.10, and $0.12, with further levels at $0.1552 and $0.1774 in a stronger move.
Analyst Darkfost noted that memecoin dominance as a share of total altcoin market cap is at an all-time low, with memecoins rarely this overlooked by the wider community. Darkfost added that some memecoins are starting to wake up, though the move is not yet broad across the market.
The total market cap of the top meme tokens stands at about $31.41 billion, with 24-hour volume around $3.33 billion. Volume had fallen 22.44% in the latest 24-hour period, showing traders are still selective.
DOGE key support remains at $0.0813, with the $0.10 level the immediate test for any continued recovery.
The post Dogecoin (DOGE) Price: Analysts Spot Bullish Chart Pattern as DOGE Closes In on Ten Cents appeared first on CoinCentral.





