Dogecoin finds itself at a pivotal moment as the meme coin tests crucial support levels near $0.22. The cryptocurrency has declined 22% this week according to CoinGecko data.
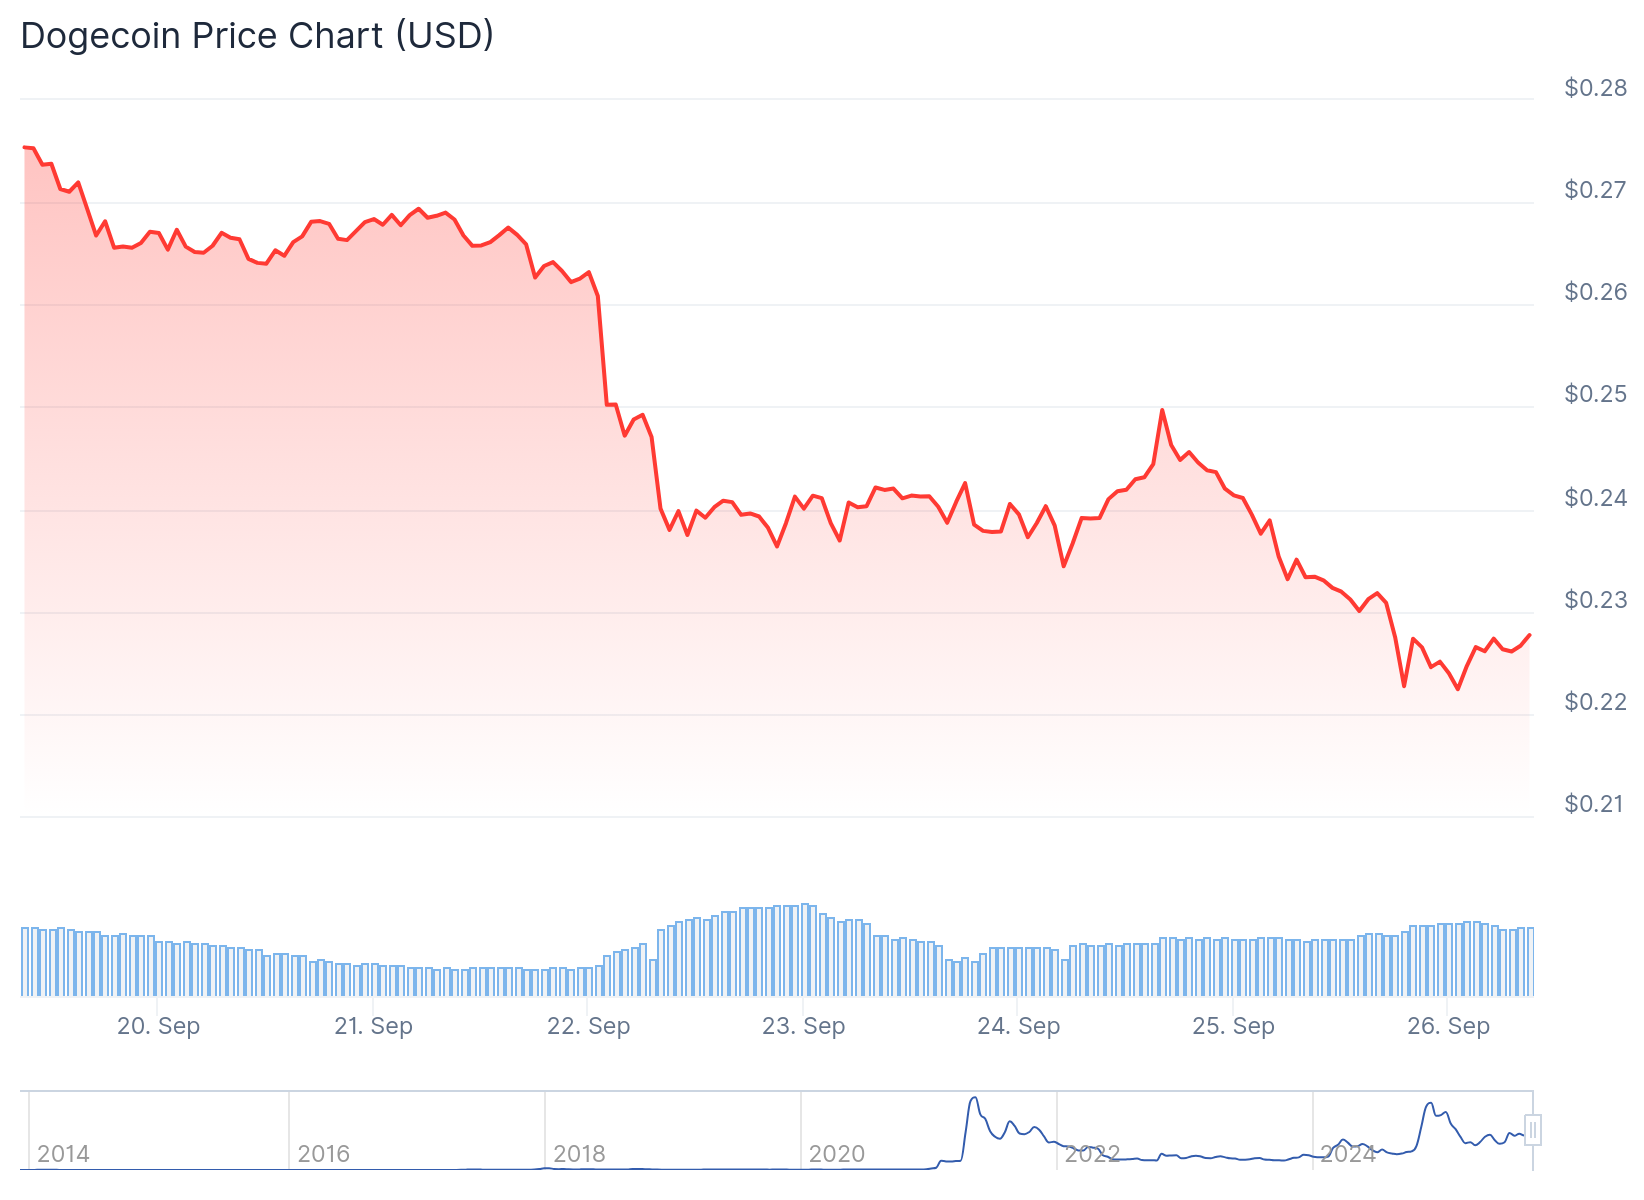
The current price action sits nearly 70% below Dogecoin’s all-time high of $0.73. Despite recent weakness, technical analysis suggests the token remains positioned for potential upside movement.
Chart analysis reveals an ascending triangle pattern that has been developing since July. This formation shows price testing the $0.22 support zone, which coincides with the 0.618 Fibonacci retracement level at $0.2288.
The triangle structure indicates potential consolidation between $0.24 and $0.29 before any breakout occurs. Maintaining current support levels could trigger momentum toward the triangle’s apex near $0.29.
Dogecoin $DOGE must hold $0.22 for a potential rebound to the triangle's x-axis at $0.29! pic.twitter.com/ZhgcCMAjue
— Ali (@ali_charts) September 26, 2025
Price has faced rejection at $0.24 on three separate occasions. Additional resistance levels appear at $0.27 and $0.28 that need clearing for sustained recovery.
Support zones include the current $0.22 level, with deeper levels at $0.21, $0.19, and $0.16. These areas have historically provided bounce points for the token.
The critical $0.14 level represents major trendline support on the weekly chart. Analysts suggest this threshold remains key for maintaining bullish structure.
If upside momentum builds, initial targets include $0.30-$0.32. Extended projections reach $0.38 and $0.42 based on the triangle pattern.
Some analysts forecast more ambitious targets, with projections as high as $1.30 representing potential 800% gains from current levels.
$DOGE Setting Up for Next Explosive Move? 🐶🚀
Dogecoin follows a repeating structure:
📈 300% ➡️ 500% ➡️ now targeting 800% rally
🔍 Price bouncing off ascending trendline support
🎯 Target = ~$1.30 if pattern repeats again!
History rhyming or just hype?#DOGE #Crypto pic.twitter.com/7YqF4YMQa0
— Bitcoinsensus (@Bitcoinsensus) September 24, 2025
Recent economic data shows weekly jobless claims decreased to 218,000 for the week ending September 20. This figure came in below expectations, indicating labor market resilience.
The US Commerce Department revised second-quarter GDP estimates upward to 3.8%. This reflects strong consumer spending and represents the strongest quarterly growth in over two years.
Such economic indicators could influence cryptocurrency rotation as investors move between traditional and digital assets.
The ascending trendline support currently sits at $0.14 on weekly charts. Historical patterns show similar setups have led to rallies of 300% and 500% in previous cycles.
These comparisons reference price movements between September and November of last year. Current corrections below $0.20 have not violated the major support structure.
At the time of analysis, DOGE trades around $0.222 as it attempts to stabilize from recent declines. The token needs to hold above $0.22 to validate the ascending triangle scenario.
The post Dogecoin (DOGE) Price: Triangle Formation Hints at Massive Move Ahead appeared first on CoinCentral.


