Dogecoin continues to face downward pressure as the memecoin trades at $0.095. The price represents a 1.46% daily decline and an 8.03% drop over the past week.
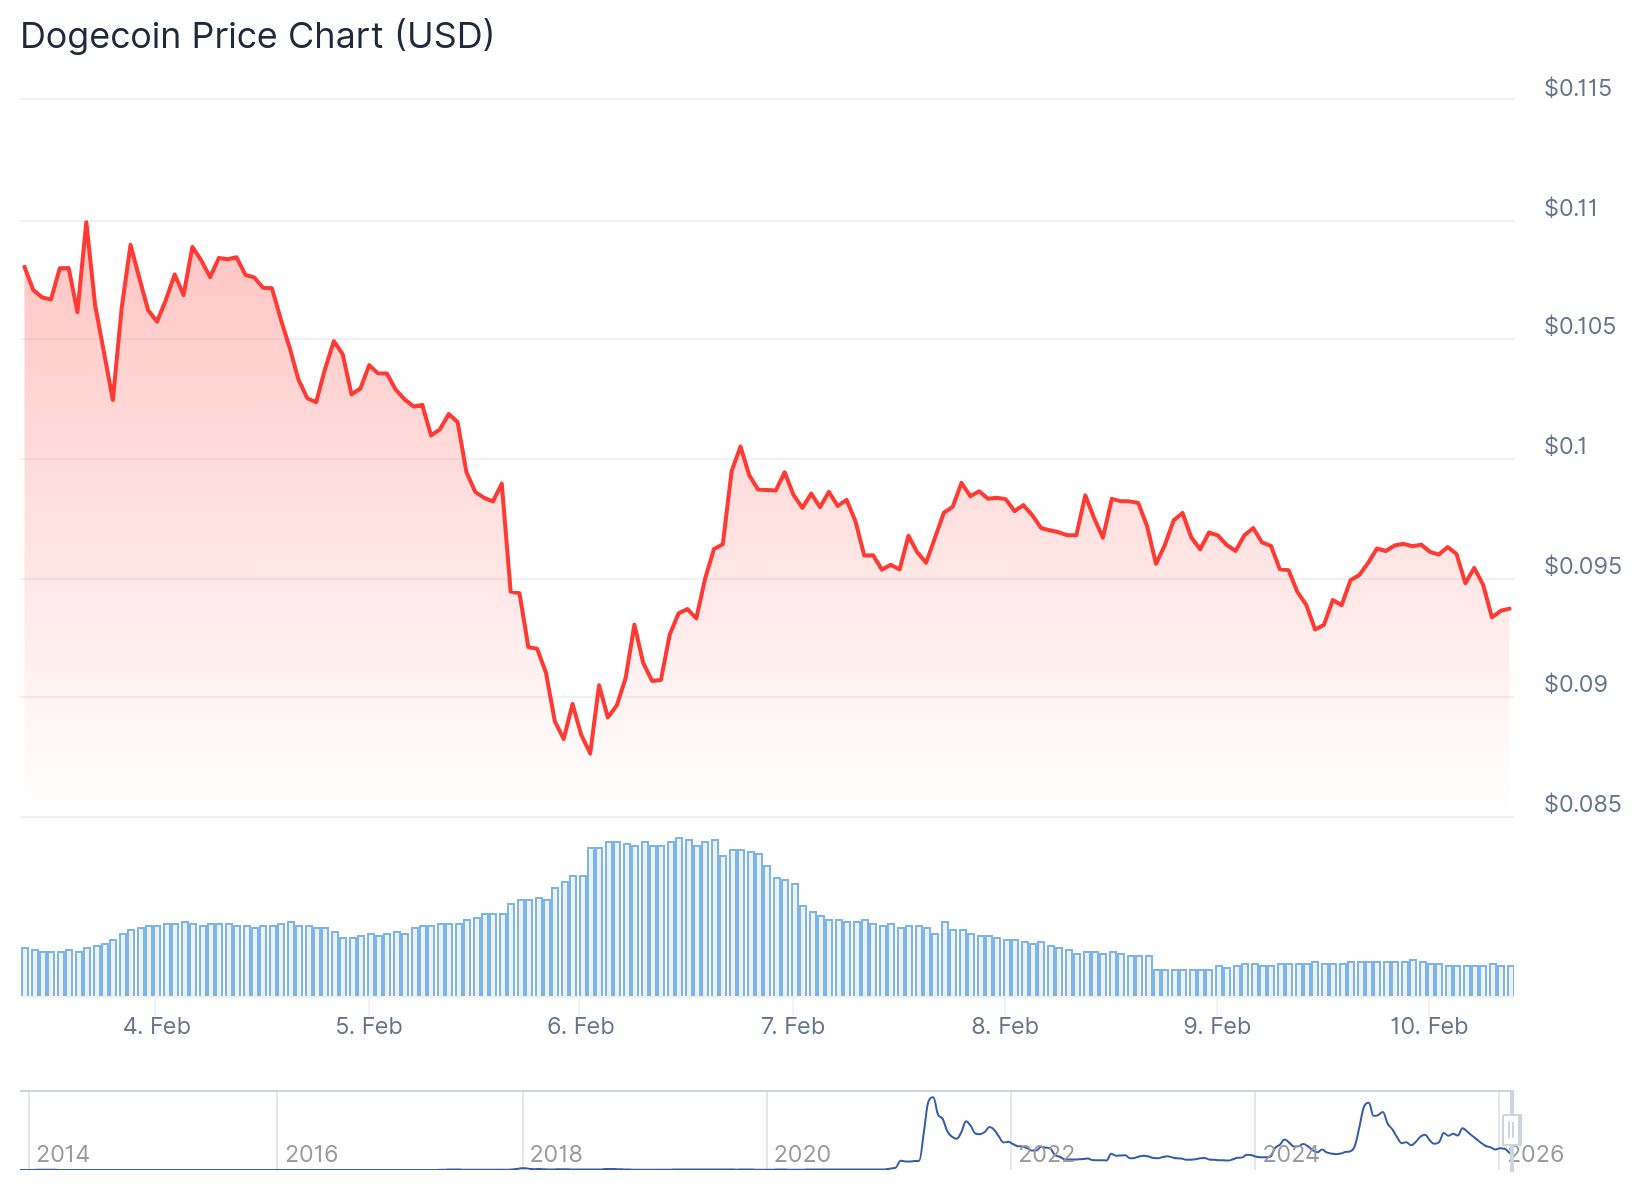
After hitting a recent high of $0.15, DOGE entered a descending channel. The memecoin fell to a low of $0.08 before staging a modest recovery.
One crypto analyst identified the current price level as potentially touching the bottom of DOGE’s long-term ascending channel. The analyst cited historical performance, noting that Dogecoin rose 9,200% over 300 days in the 2017 cycle. In the previous cycle, the memecoin gained 26,485% over 154 days.
$DOGE shows a exactly reached the bottom.
In the 2017 cycle, it rose 9,200% in 300 days, and in the previous cycle, it rose 26,485% in 154 days.
The huge rise is about to begin. https://t.co/uCSrLNPU3R pic.twitter.com/1Utd4YGVXt
— CW (@CW8900) February 8, 2026
Based on these historical patterns, the analyst suggested that if DOGE dips below $0.1, it signals a bottom. A subsequent rebound could push the price toward $0.3.
However, market data paints a different picture. The Demand and Supply Zones indicator shows $0.09 serving as the current supply zone. In this area, DOGE faces strong selling pressure that previously resulted in the decline to $0.08.
The Buyer-Seller Dominance indicator reveals sellers currently control the market. Seller volume reached 5.4 billion compared to just 2.8 billion in buyer volume.
According to data from Coinalyze, buyers have failed to overcome sellers for eleven consecutive days. Sell volume hit 700 million in the past 24 hours alone.

The memecoin’s Relative Strength Index dropped to 31, placing it well into bearish territory. This signals continued sell-driven downward momentum.
The Directional Movement Index fell to 6.3, validating the weak trend strength. These two momentum indicators suggest DOGE remains in a weakened position.
Crypto analyst VisionPulsed presented a different perspective in a February 8 video. He argued the market hasn’t reached true capitulation yet.
VisionPulsed pointed to continued bullishness on social media platforms as evidence. He stated that when people still express bullish views, the market hasn’t declined enough.
The analyst explained that capitulation lows often coincide with narrative shocks that traders later identify as the cause. He referenced the Terra/Luna collapse as an example of such events.
$Doge/monthly#Dogecoin has reached the best buy level on the channel
pic.twitter.com/e34KRM1kMi
— Trader Tardigrade (@TATrader_Alan) February 9, 2026
VisionPulsed noted that historical Dogecoin bottoms have aligned with RSI reaching oversold conditions. He stated DOGE has not yet hit oversold levels in the current downswing.
“We’re one more leg down away from hitting oversold,” the analyst said. He predicted the next move down could take Dogecoin to $0.05.
He used Bitcoin’s Stochastic RSI across multiple timeframes as a guide for the broader crypto market. The analyst warned that rallies repeatedly fail when Stoch RSI reaches overbought territory.
VisionPulsed allowed for scenarios where a later macro shock could produce a second low. He compared this to the pattern seen during the COVID-era market decline.
Despite predicting further downside, the analyst believes the correction is “probably almost done.” He expects a larger rally after spring.
The analyst also floated a longer-term view. He suggested Dogecoin’s “real bull run” could begin around July 2027.
For a bullish reversal to occur, DOGE would need to reclaim its demand zone around $0.15. Current price action suggests the memecoin will likely hover around $0.09, with $0.1 as the upper boundary.
Buyers currently provide enough support to prevent further immediate decline. However, the overwhelmingly bearish market structure suggests additional losses remain possible if selling pressure continues.
The post Dogecoin (DOGE) Price: Is the Bottom Really In? Analysts Weigh In appeared first on CoinCentral.


