Dogecoin is trading close to $0.09 after a 4.5% jump that briefly pushed the price toward $0.10. The move saw DOGE outperform both Bitcoin and Ether as capital rotated into higher-risk crypto assets.
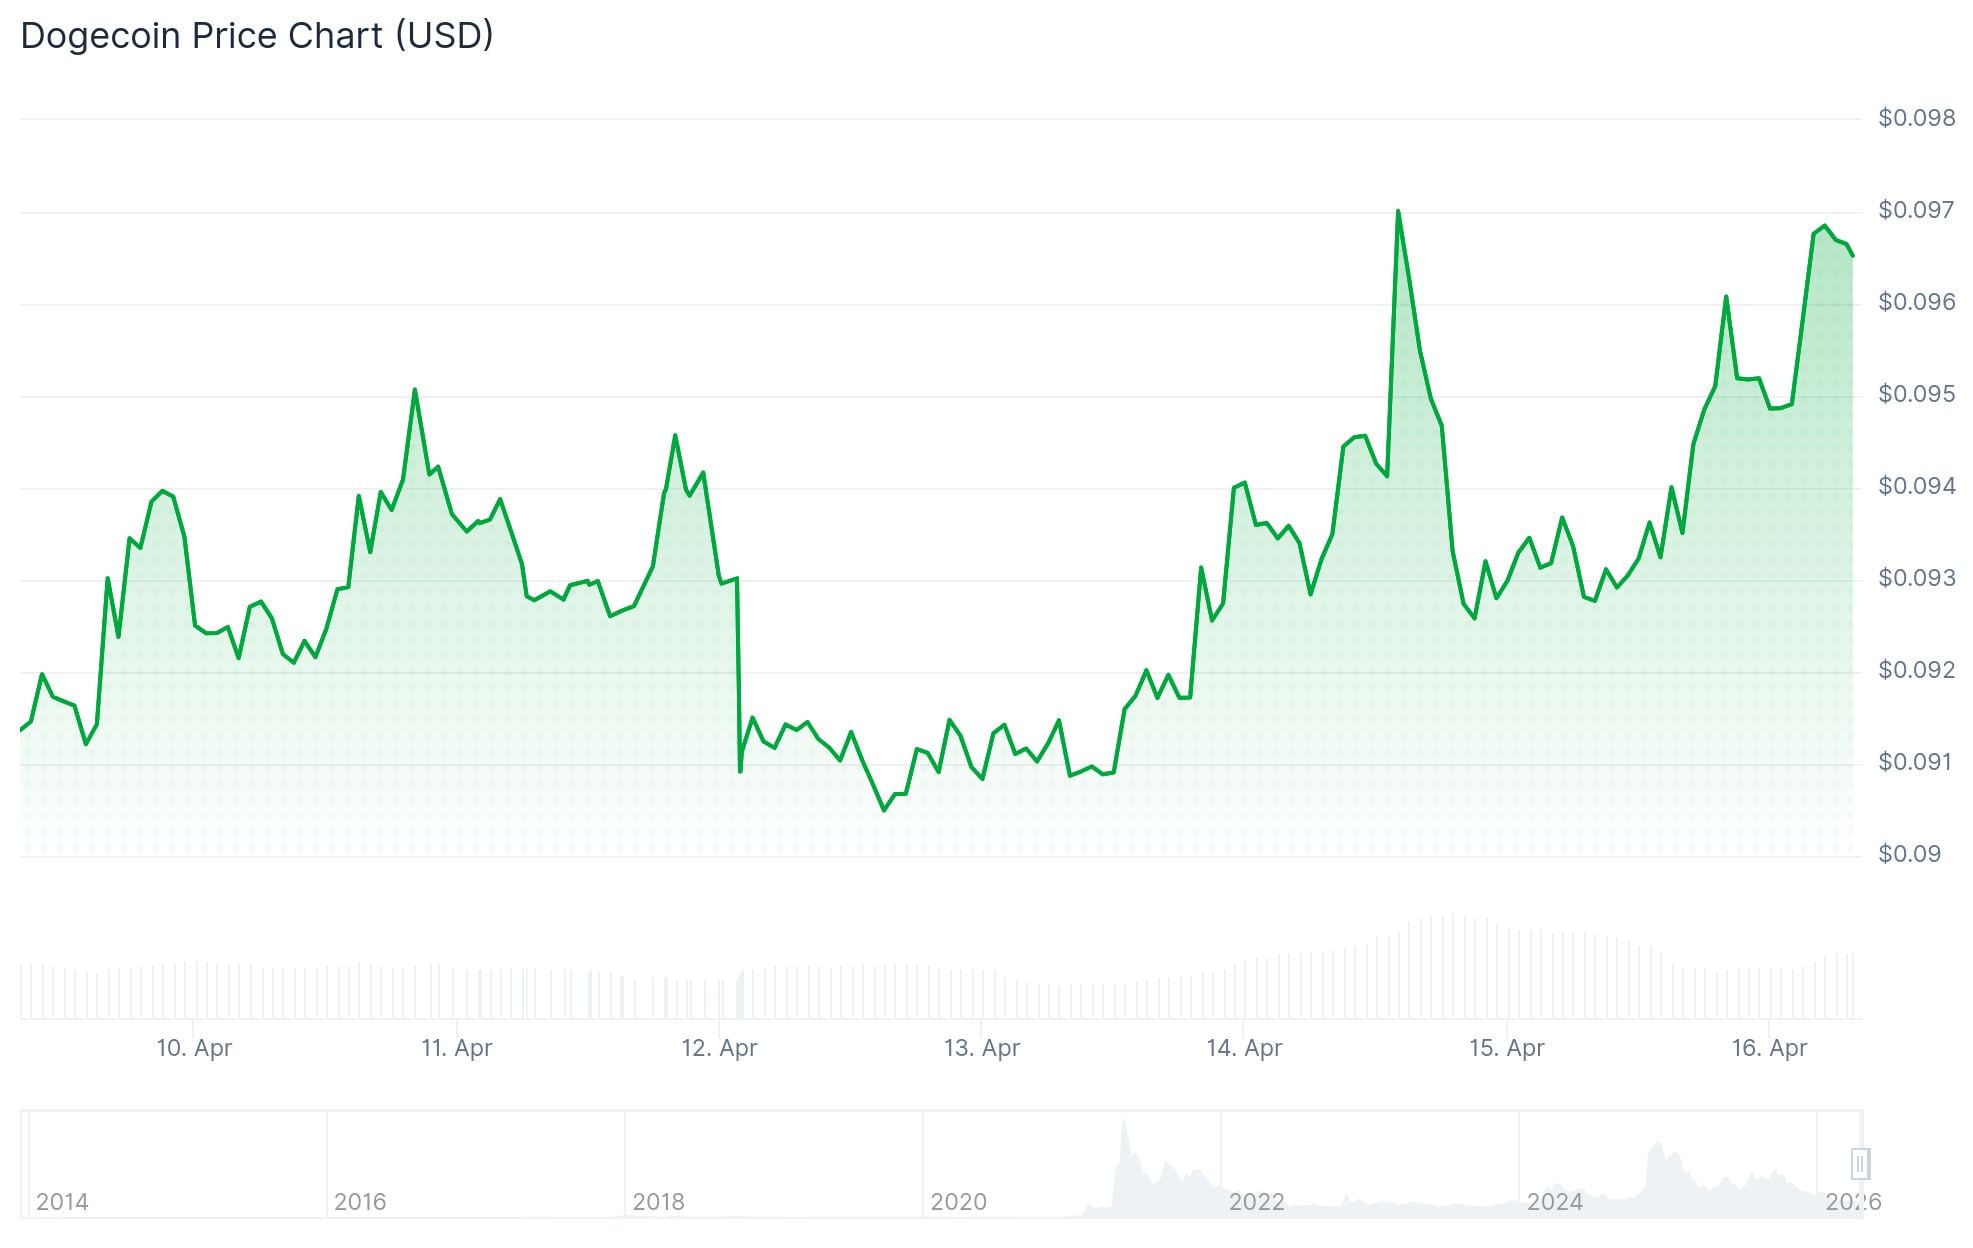
The rally took DOGE from $0.093 to $0.098, breaking through the $0.095 resistance zone on strong volume. Price built through a series of higher lows before accelerating in the final hour of the session.
Despite the price strength, on-chain activity remains subdued. Daily active addresses are trending lower, which suggests the move is being driven more by derivatives and leveraged positioning than actual network demand.
Late-session buying spikes pointed to institutional involvement, particularly during the push through $0.097. Volume confirmed real participation, not just thin liquidity movement.
Crypto analyst Ali Charts flagged a clear fakeout on the 12-hour chart. DOGE attempted to break out of a descending triangle, but the descending trendline held firm as resistance and immediately rejected the price.
Dogecoin $DOGE: Reality Check
DOGE had a clear fakeout yesterday as it attempted to break out of a descending triangle on the 12-hour chart.
The descending trendline held firm as resistance, immediately rejecting the price. When a breakout fails this sharply, the market… pic.twitter.com/iQXlwAjj5A
— Ali Charts (@alicharts) April 16, 2026
Ali Charts noted that when a breakout fails this sharply, the market typically looks for liquidity at the bottom of the structure. The analyst pointed to $0.088 as the likely retest target, calling it the “definitive line in the sand.”
The RSI stands at 46.30, reflecting balanced pressure between buyers and sellers. The MACD histogram is printing flat, showing that bearish momentum has slowed but has not shifted bullish.
Bollinger Bands show DOGE sitting closer to the lower boundary near $0.09, with the upper band near $0.10 continuing to act as resistance.
Multiple short- and mid-term moving averages are clustered around $0.09, reinforcing it as a support zone. DOGE still trades well below its long-term average near $0.14, reflecting a broader bearish structure.
Traders are watching $0.096 as near-term support. Holding this level keeps the current breakout attempt intact.
$0.104 is the key resistance level. A clean break above it would shift the structure more clearly bullish. A drop back below $0.092–$0.090 would likely expose DOGE to a deeper pullback.
The broader structure remains a compression below descending resistance rather than a confirmed trend reversal.
The post Dogecoin (DOGE) Price: Is This Rally Real? Why Traders Are Not Convinced Yet appeared first on CoinCentral.

