Dogecoin has captured trader attention after a sharp 10% rally brought the meme coin back above the $0.24 mark. The price movement comes as the cryptocurrency tests a critical technical zone that analysts say could determine its next major direction.
The recent surge has pushed DOGE past several key resistance levels. After a period of consolidation, the coin successfully retested the $0.24 level, which technical analysts view as a positive signal for continuation.
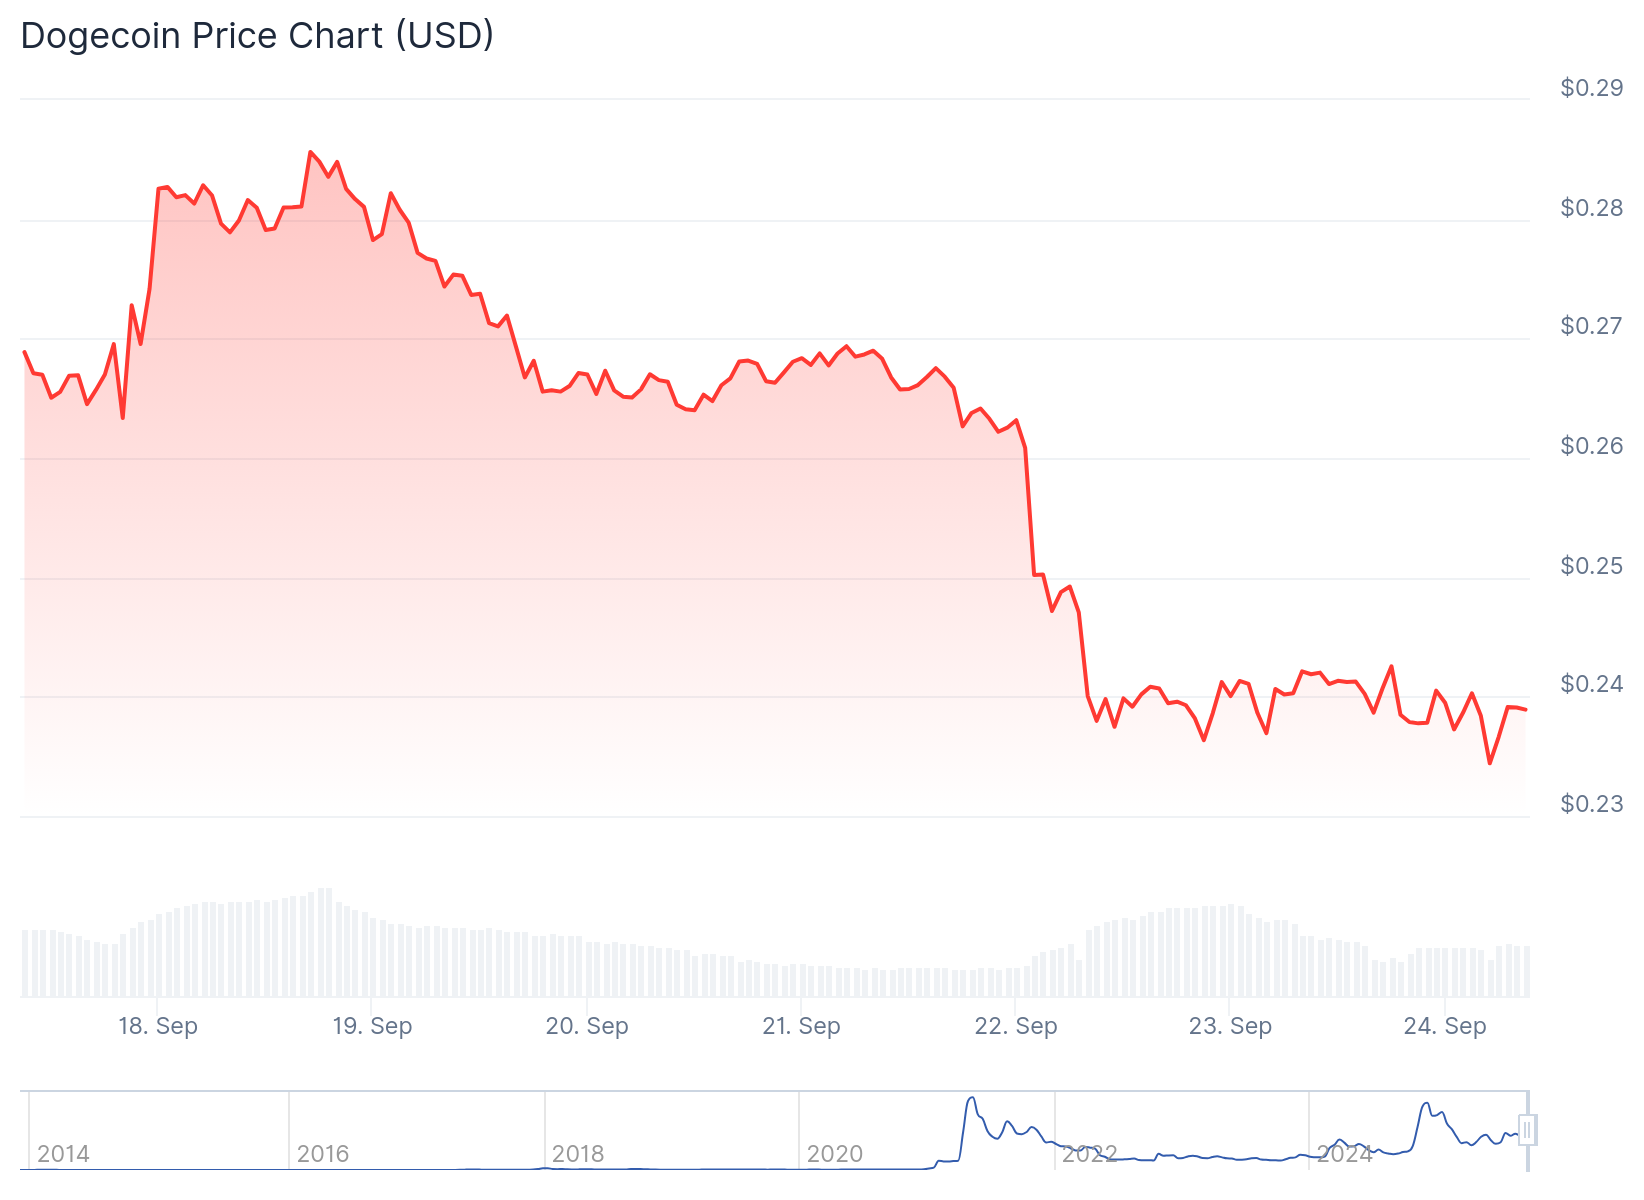
Charts show Dogecoin breaking above a descending resistance line. This breakout pattern often precedes larger price movements in cryptocurrency markets. The successful retest of support has given traders confidence in the current setup.
Technical analysis reveals DOGE trading within important Fibonacci levels. Key zones include $0.2403, $0.2457, $0.2502, $0.2276, and $0.2097. However, the $0.23 level appears most critical for determining near-term direction.
Analysts are watching for DOGE to hold above $0.23. A sustained break below this level could trigger a deeper correction. Conversely, maintaining support could open the door for moves toward $0.26 or $0.28.
$DOGE: Sitting right in the B-wave danger zone.
Hold above $0.23 and it's moon time. Lose it and we go full meme mode. pic.twitter.com/YDQBv4ZNAS— More Crypto Online (@Morecryptoonl) September 23, 2025
The current price action resembles patterns that preceded previous explosive moves in Dogecoin. Technical forecasters point to potential wave-3 momentum that could extend toward the $0.45-$0.50 range after any pullback entries.
Whale accumulation has provided steady support at current price levels. Large holders appear to be building positions around the $0.22-$0.24 zone, creating a floor for the cryptocurrency.
Retail participation has also increased alongside the recent price action. Market sentiment indicators show a “Greed” reading of 72, reflecting high investor appetite for risk assets like meme coins.
Several technical patterns are forming that could support further upside. Analysts identify a potential double bottom pattern, which historically signals strong trend reversal potential. If confirmed, this setup could provide momentum for DOGE to reach the $0.42 level.
Additional chart patterns include what some analysts describe as megaphone formations. These patterns often precede volatile price movements in either direction.
Some technical models forecast moves into the $0.60-$0.70 zone if DOGE breaks out from long-standing upper trendlines. These projections depend on sustained momentum and broader market support.
Thinking something like this for $DOGE pic.twitter.com/jEEaLwEfJy
— Surf (@_CryptoSurf) August 10, 2025
More conservative targets point to the $0.40 level if Dogecoin breaks above current resistance. Wave analysis suggests potential extension toward $0.45-$0.50 after any corrective pullbacks.
The $0.29 level represents another key breakout point according to chart analysis. A successful move above this resistance could trigger rallies toward $0.80 later in 2025, based on historical pattern recognition.
Market psychology continues to favor meme coins during periods of broader cryptocurrency optimism. Dogecoin’s retail-focused trading base responds quickly to positive technical developments and social media sentiment.
Current support levels remain at $0.22-$0.24, with whale accumulation providing underlying strength. Technical breakouts above $0.29 could accelerate momentum toward higher targets throughout the remainder of 2025.
The post Dogecoin (DOGE) Price: Double Bottom Pattern Points to Possible Reversal appeared first on CoinCentral.


