Ethereum dropped sharply over the past day, falling from around $2,385 to a low of $2,025. The price is now trading below $2,100 and the 100-hourly Simple Moving Average.
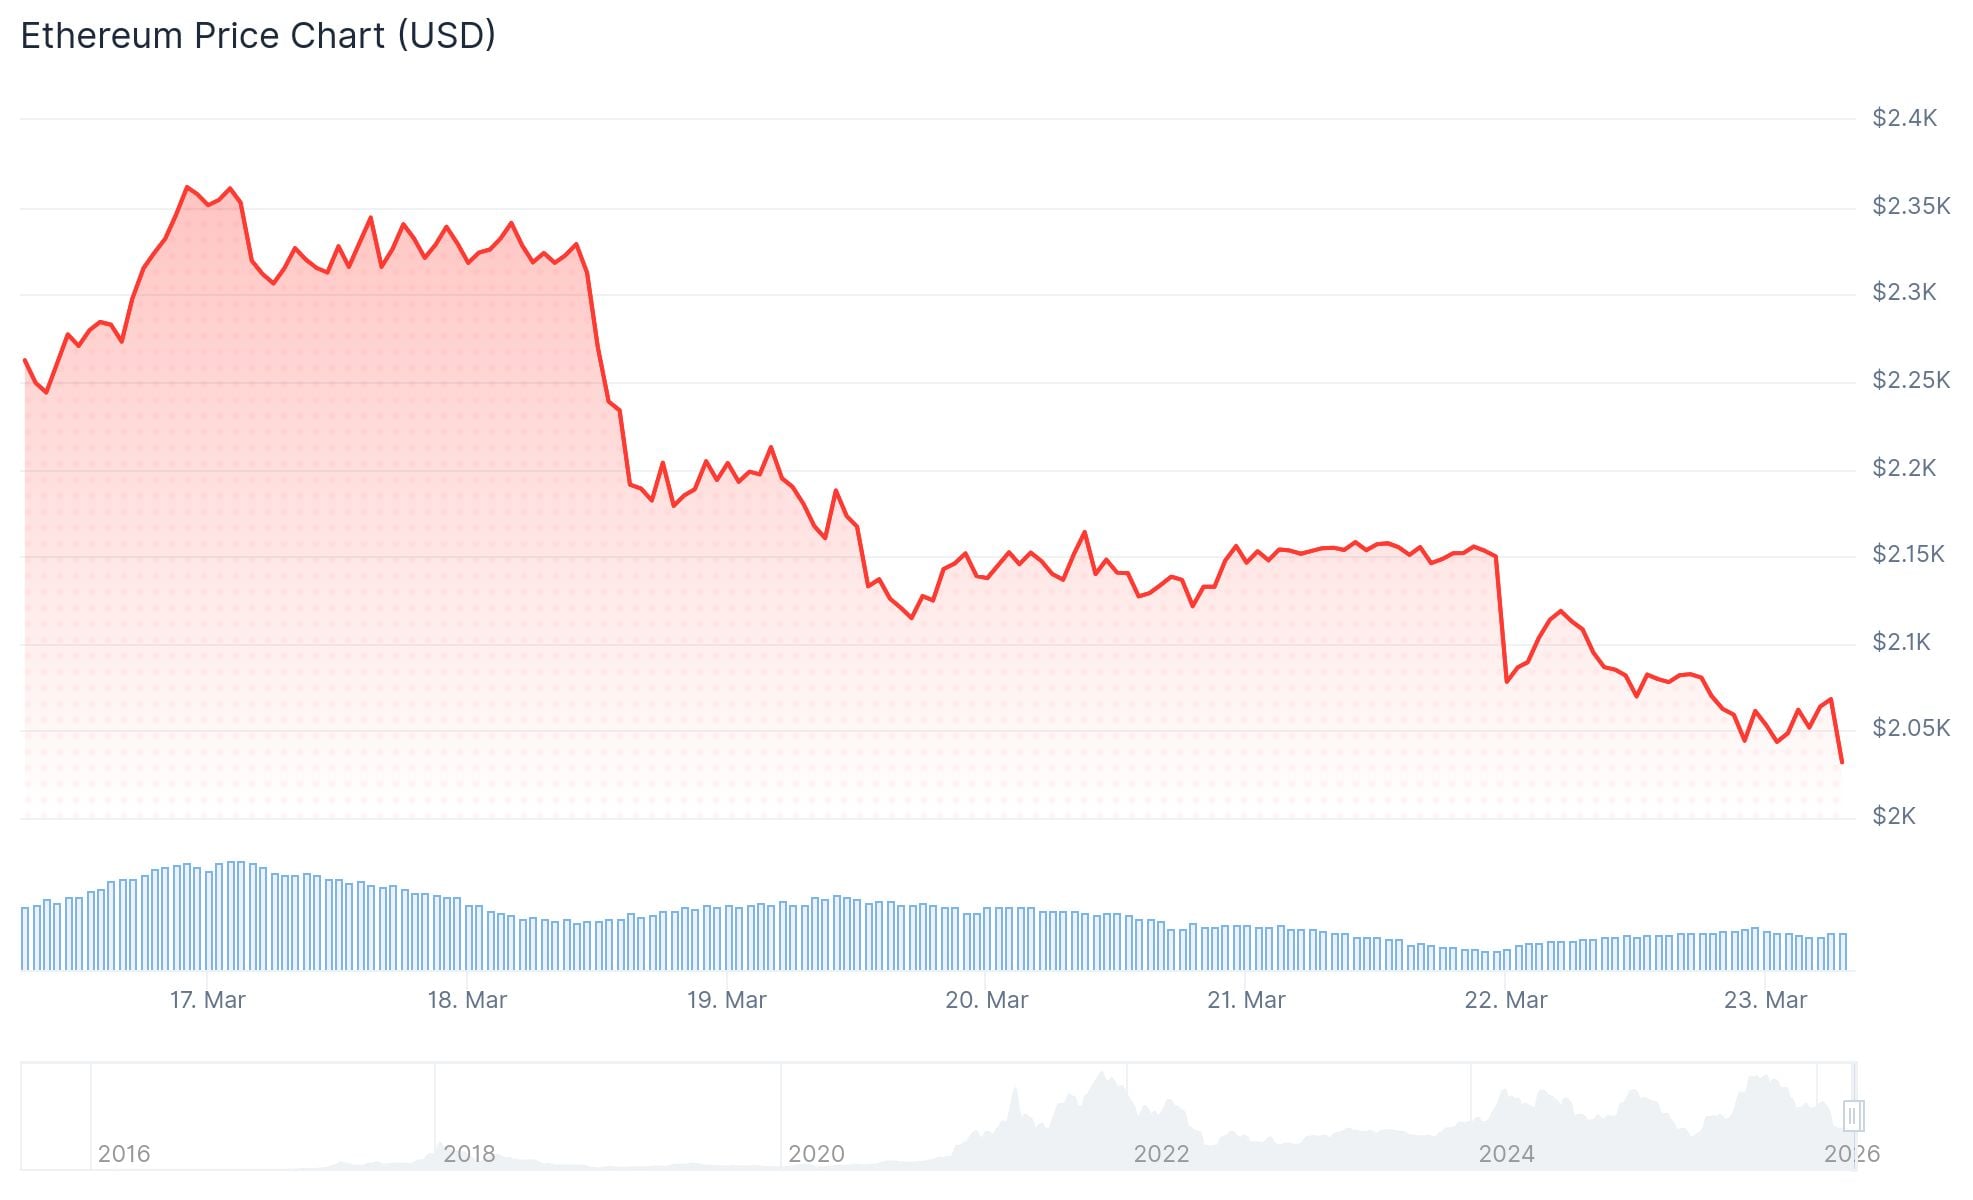
The decline began after ETH failed to hold above $2,220. It broke through $2,150 and $2,120 before briefly spiking below $2,050.
ETH is currently consolidating losses below the 23.6% Fibonacci retracement level of the move from $2,385 to $2,025. Two bearish trend lines are visible on the hourly chart, with resistance sitting at $2,120 and $2,165.
The first key resistance level is at $2,120, which also aligns with the 100-hourly Simple Moving Average. A move above that would put $2,165 in play as the next hurdle.
If ETH clears $2,165, the 50% Fibonacci retracement level sits near $2,200. A break above that zone could open the way toward $2,250 or $2,300.
On the downside, initial support sits near $2,040. Below that, the $2,025 zone is the first major floor.
A clear break below $2,025 would put the $2,000 level in focus. Further losses could bring $1,965 into view, with $1,880 acting as deeper support.
$ETH seems to be forming head and shoulder pattern.
If Ethereum loses the $2,040 level, expect a massive dump. pic.twitter.com/EZGbDEYvq2
— Ted (@TedPillows) March 22, 2026
Crypto analyst Ted Pillows posted on X that ETH appears to be forming a head and shoulders pattern. He wrote: “$ETH seems to be forming head and shoulder pattern. If Ethereum loses the $2,040 level, expect a massive dump.”
Ethereum spot ETFs recorded net outflows of $59.94 million for the week of March 16–20, according to SoSoValue data reported by PANews on March 23.
From March 16 to March 20 (ET), Bitcoin spot ETFs recorded net inflows of $95.18 million, marking four consecutive weeks of net inflows. Ethereum spot ETFs saw net outflows of $59.94 million. SOL spot ETFs recorded net inflows of $21.10 million, while XRP spot ETFs saw net… pic.twitter.com/oI6NJjhwZl
— Wu Blockchain (@WuBlockchain) March 23, 2026
BlackRock’s ETHA led outflows with $69.59 million leaving the fund last week. ETHA’s historical total net inflow still stands at $11.91 billion.
Fidelity’s FETH saw $61.62 million in outflows over the same period. Its historical total net inflow sits at $2.32 billion.
The only ETF to record net inflows last week was the Grayscale Ethereum Mini Trust (ETH), which brought in $6.87 million. Its historical total net inflow has reached $1.85 billion.
As of March 23, total Ethereum spot ETF net assets stand at $12.33 billion, representing 4.79% of Ethereum’s total market cap. The historical cumulative net inflow across all Ethereum ETFs is $11.73 billion.
The post Ethereum (ETH) Price: Head and Shoulders Pattern Forming — What Happens if $2,040 Breaks? appeared first on CoinCentral.

