Ethereum has fallen roughly 50% from its October 2025 high of around $4,700 to current levels near $2,300. Despite the prolonged decline, on-chain data is showing signs that buyers are stepping in.
Data from CryptoQuant shows the taker buy/sell ratio’s 30-day moving average has reached its highest level since January 2023. This metric tracks how much aggressive buying is outpacing sell orders on exchanges.
Buyers have been absorbing available supply even as price trends lower. This kind of behavior is often associated with larger investors building positions during a down move.
Separate CryptoQuant data shows the 180-day moving average of new smart contract deployments has hit a record high. Developer activity is growing even as the token price remains under pressure.
Historically, spikes in smart contract activity have preceded price recoveries. The divergence between network growth and token price suggests fundamentals are outpacing current valuation.
Ethereum spot ETFs recorded a net inflow of $155 million during the week of April 20–24, according to SoSoValue data cited by Odaily. That marks three straight weeks of net inflows.
Spot Bitcoin ETFs See 824M USD Weekly Net Inflows, Fourth Straight Week of Gains
From April 20 to April 24 (ET), spot Bitcoin ETFs recorded net inflows of $824 million, marking four consecutive weeks of net inflows. Spot Ethereum ETFs saw net inflows of $155 million, marking… pic.twitter.com/W65rajQOCO
— Wu Blockchain (@WuBlockchain) April 27, 2026
BlackRock’s ETHA led inflows with $138 million for the week, bringing its total historical net inflow to $11.97 billion. BlackRock’s ETHB added $60.9 million. Grayscale’s ETHE saw the largest outflow at $49.2 million. Total net assets across Ethereum spot ETFs now stand at $13.79 billion.
Analyst Ted (@TedPillows) posted that ETH is moving sideways and flagged that cancelled US-Iran peace talks could make next week volatile. He noted that reclaiming $2,400 could open up the $2,470–$2,500 liquidity zone, while losing $2,300 could trigger a retest of $2,150–$2,200.
$ETH is going sideways for now.
US-Iran peace talks have been cancelled, which means next week will be very crucial.
If Ethereum manages to reclaim the $2,400 level, it'll tap the $2,470-$2,500 liquidity.
And if it loses the $2,300 zone, a retest of $2,150-$2,200 support level… pic.twitter.com/Ko20h5qvbv
— Ted (@TedPillows) April 26, 2026
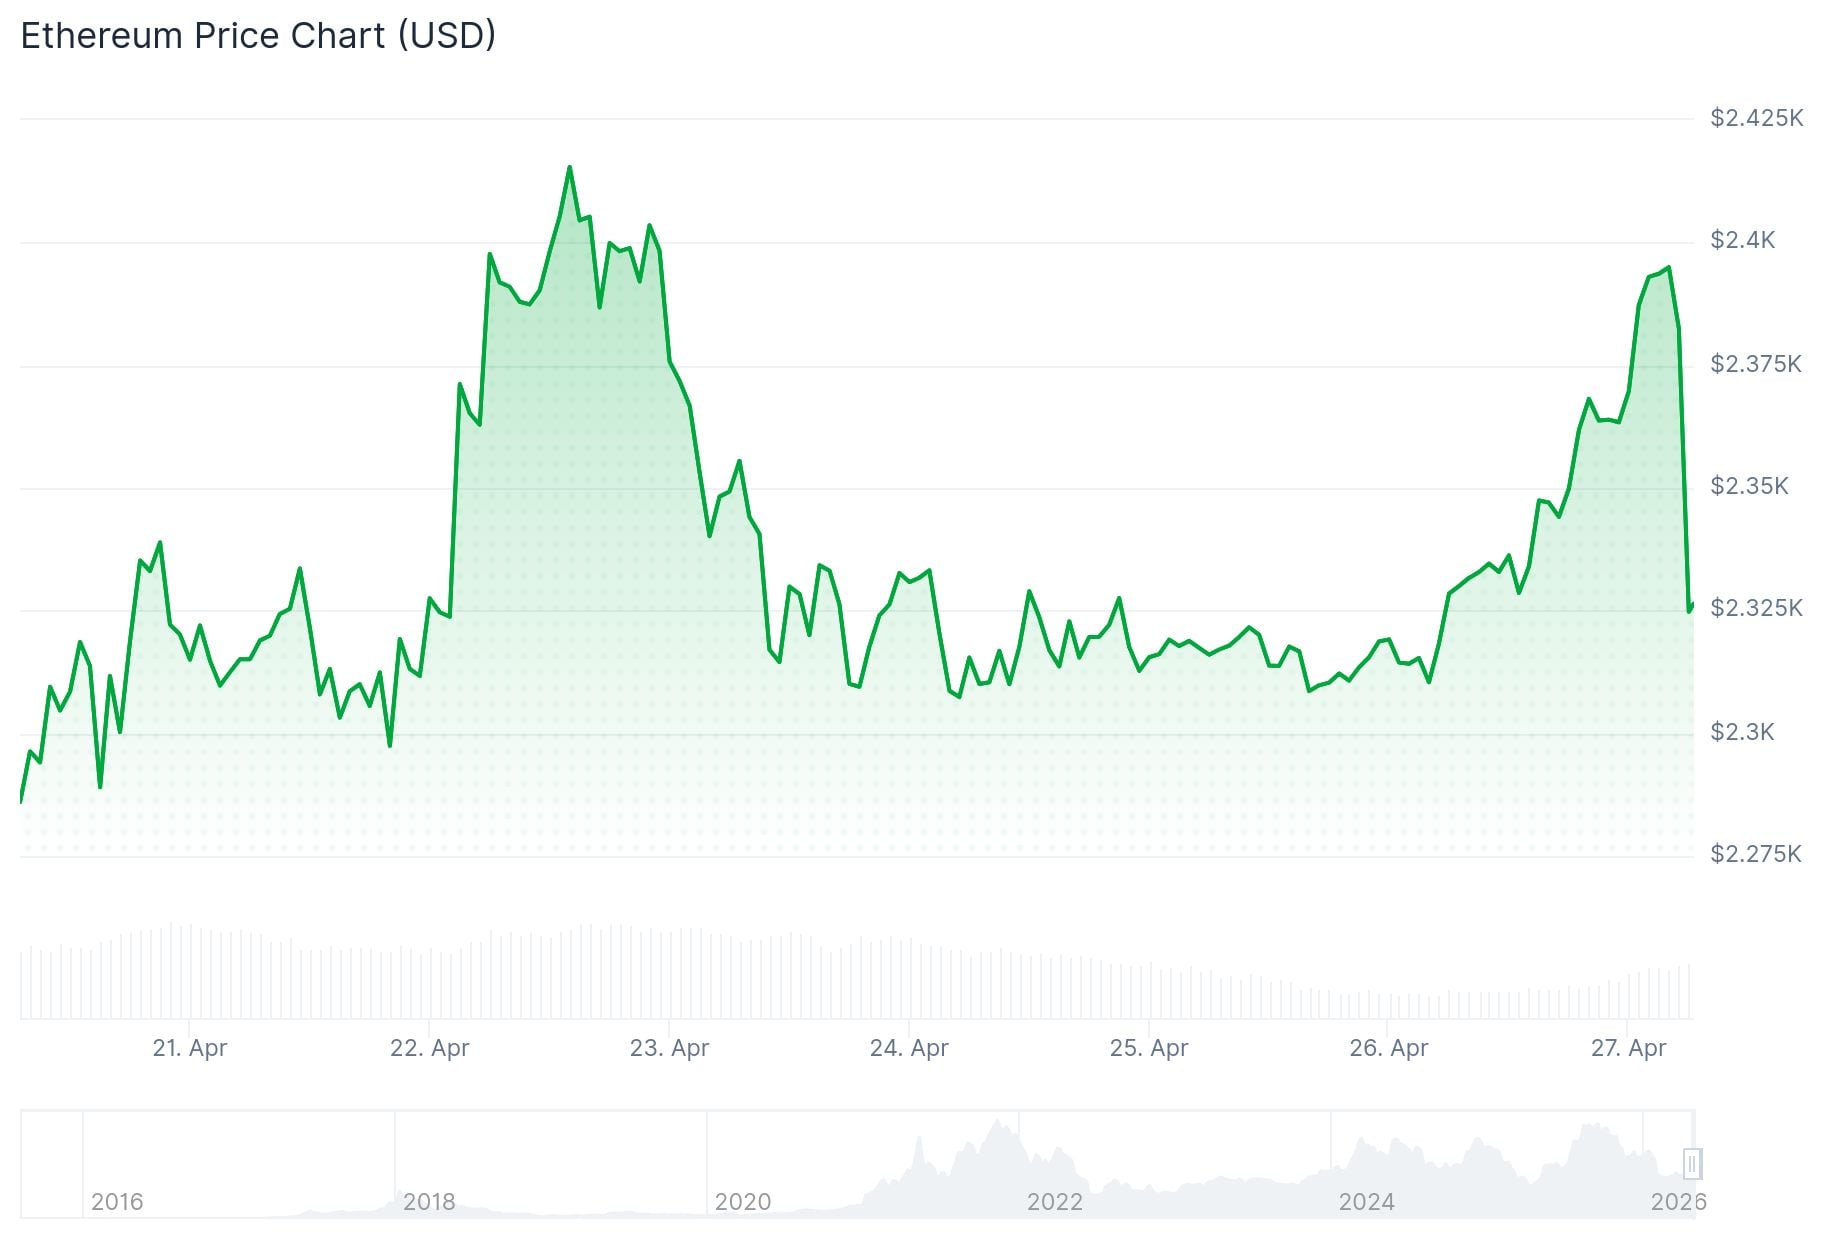
On the hourly chart, Ethereum broke above a contracting triangle with resistance at $2,320. Price reached a high of $2,404 before consolidating. It is currently trading above $2,370 and the 100-hour simple moving average.
Immediate resistance sits at $2,400, then $2,420 and $2,450. A break above $2,450 could push toward $2,500 and potentially $2,550–$2,565.
On the downside, $2,330 is the first key support. Below that, $2,285 and $2,200 are the main levels to watch.
NEW: BITMINE TO BUY 10,000 ETH FROM ETHEREUM FOUNDATION
Tom Lee’s Bitmine Immersion Technologies will acquire 10,000ETH from the Ethereum Foundation via OTC deal worth $23.9M, bringing total holdings to 4.98M ETH, moving the firm closer to its 5% supply target. pic.twitter.com/5gaNwUPHYL
— Coin Bureau (@coinbureau) April 27, 2026
Bitmine Immersion Technologies, associated with Tom Lee, announced it will acquire 10,000 ETH from the Ethereum Foundation via an OTC deal worth $23.9 million, which would bring its total holdings to 4.98 million ETH.
The post Ethereum (ETH) Price: Bulls Are Quietly Loading Up — Here’s What the Data Shows appeared first on CoinCentral.

