Ethereum is trading at around $1,665 to $1,680 after a brief bounce from a swing low of $1,603. The asset is down 0.63% over the last 24 hours, with a 24-hour trading volume of $10.20 billion and a market cap of $201.17 billion.
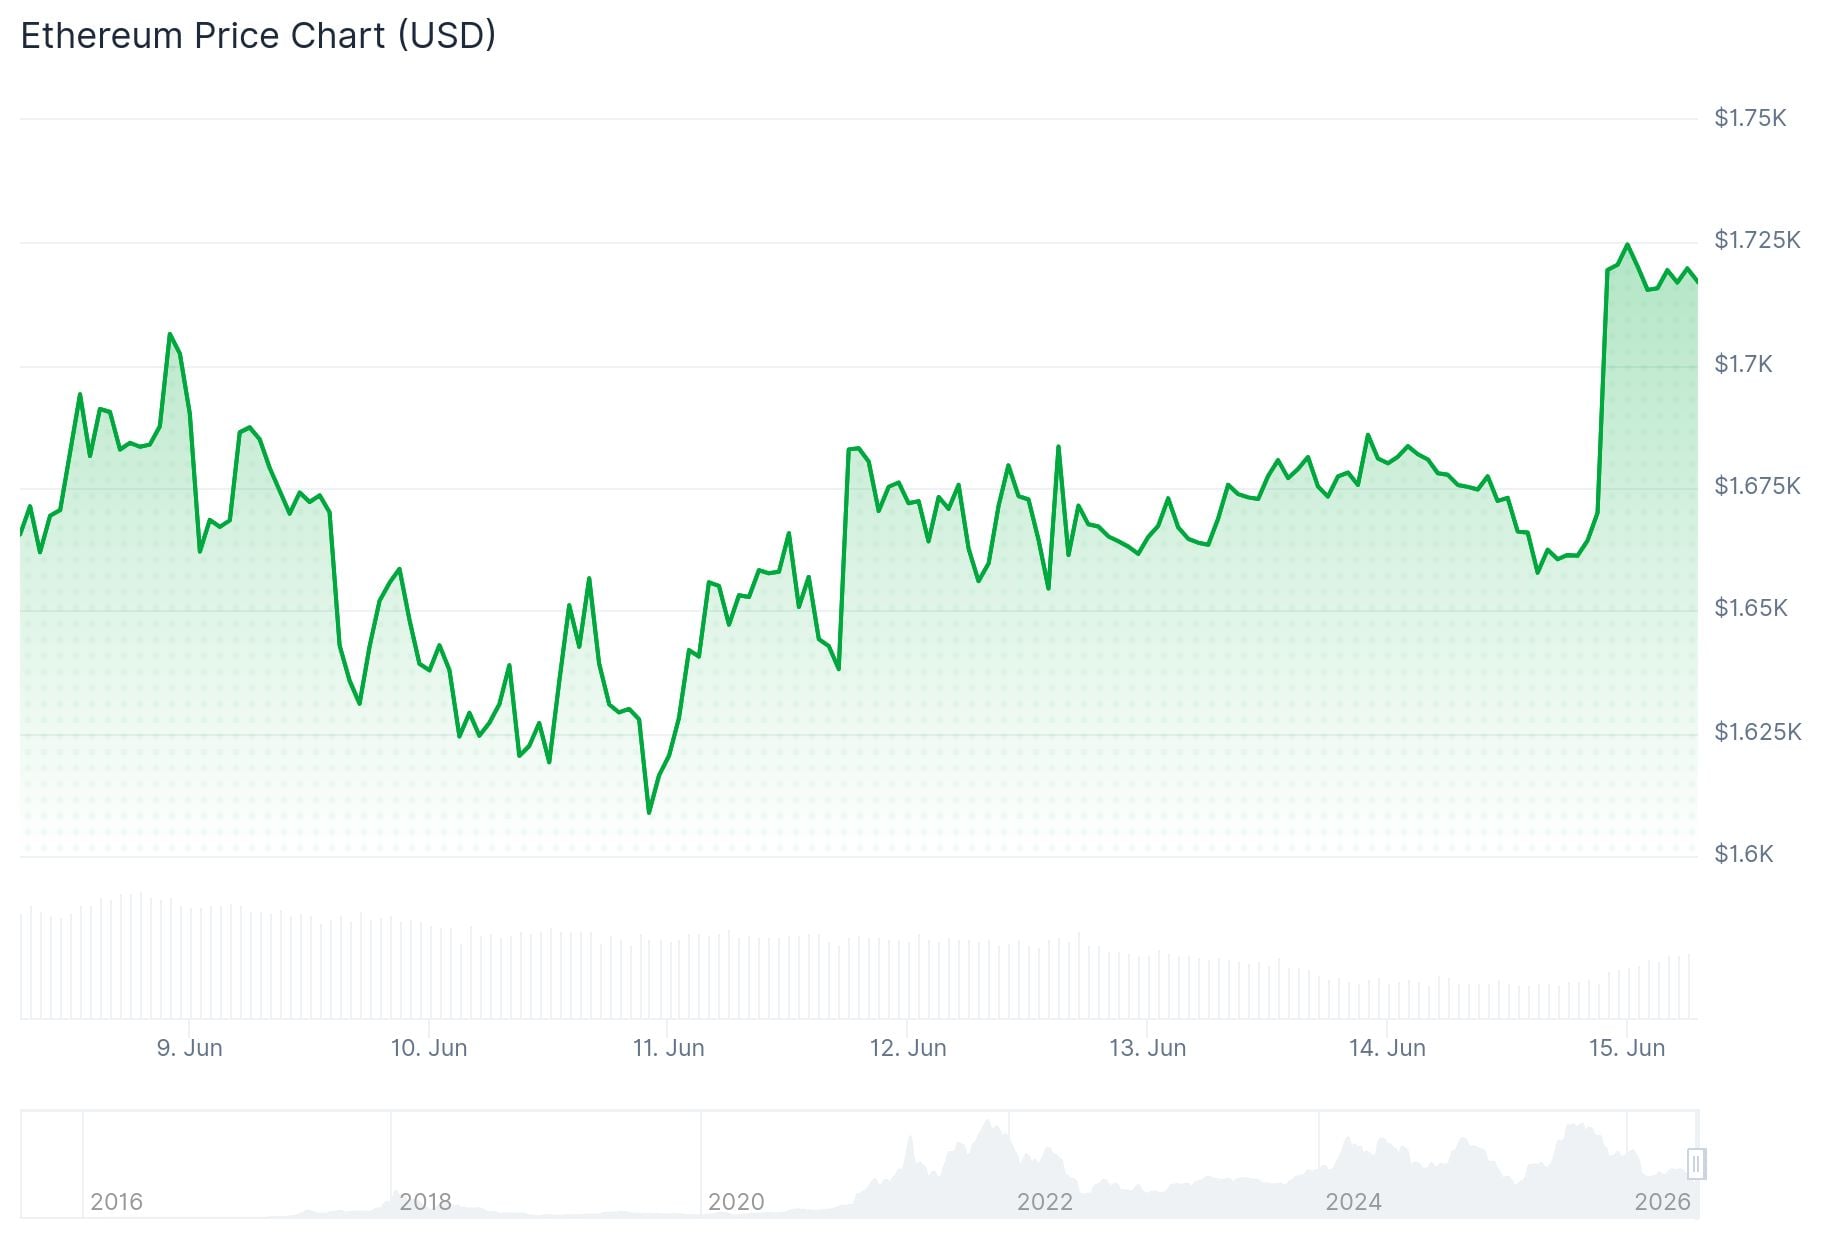
The price climbed to a high of $1,731 before pulling back. It is now consolidating above the 23.6% Fibonacci retracement level of the move from $1,603 to $1,731.
On June 14, 2026, crypto analyst Ash Crypto posted that Ethereum is “the most oversold it has ever been” based on historical market data. He pointed out that ETH has dropped nearly 70% from its previous all-time high and is now trading at price levels last seen four years ago.
$ETH is now the most oversold it has EVER been in its history.
– Down -70% from its ATH
– Price at the same level as 4 years ago
– Monthly RSI more oversold than the 2018 and 2022 bear market bottomsIn the last bear cycle, ETH crashed -82% from its ATH and formed a bottom in… pic.twitter.com/ensndVp1Gr
— Ash Crypto (@AshCrypto) June 14, 2026
Ash Crypto also noted that the monthly RSI is currently lower than the readings recorded during the 2018 and 2022 bear markets. He compared the current setup to June 2022, when Ethereum bottomed after falling 82% from its peak.
Analyst Ted Pillows added that ETH has broken out of its short-term downtrend. He said a move above $1,700 could open the door to a rally toward the $1,850–$1,900 range.
$ETH has broken out of its short-term downtrend.
If Ethereum breaks above the $1,700 level, it could rally towards the $1,850-$1,900 level. pic.twitter.com/KdK32MSFJX
— Ted (@TedPillows) June 14, 2026
ETH is holding above the 100-hourly Simple Moving Average and a bullish trend line with support at $1,665. That trend line also lines up with the 50% Fibonacci retracement of the $1,603 to $1,731 move.
Immediate resistance is at $1,720, followed by $1,740 and $1,780. A break above $1,780 could push ETH toward $1,850. Beyond that, targets sit at $1,880 and $1,920.
On the downside, a failure to clear $1,740 could bring ETH back to the $1,680 support area. A drop below $1,665 would bring $1,650 and then $1,620 into play, with $1,600 acting as the key floor.
The MACD histogram is showing a positive reading of 3.15, suggesting selling pressure is beginning to ease. The MACD line sits at -126.82, with the signal line at -129.97, pointing to a weak bullish divergence.
The Bollinger Bands had previously seen Ethereum spike toward the lower band near $1,456.90 during peak selling. The $1,802.52 level is now marked as a key resistance on the indicator.
ETH is currently trading above $1,680 and holding the 100-hourly moving average as buyers attempt to maintain the short-term recovery.
The post Ethereum (ETH) Price: ETH Hits $1,700 as Analysts Say It Has Never Been This Oversold appeared first on CoinCentral.

