Ethereum has quietly put together a recovery that is now catching the attention of both technical traders and institutional investors. ETH climbed to around $1,811–$1,822, up roughly 20% from its 2026 low of $1,517.
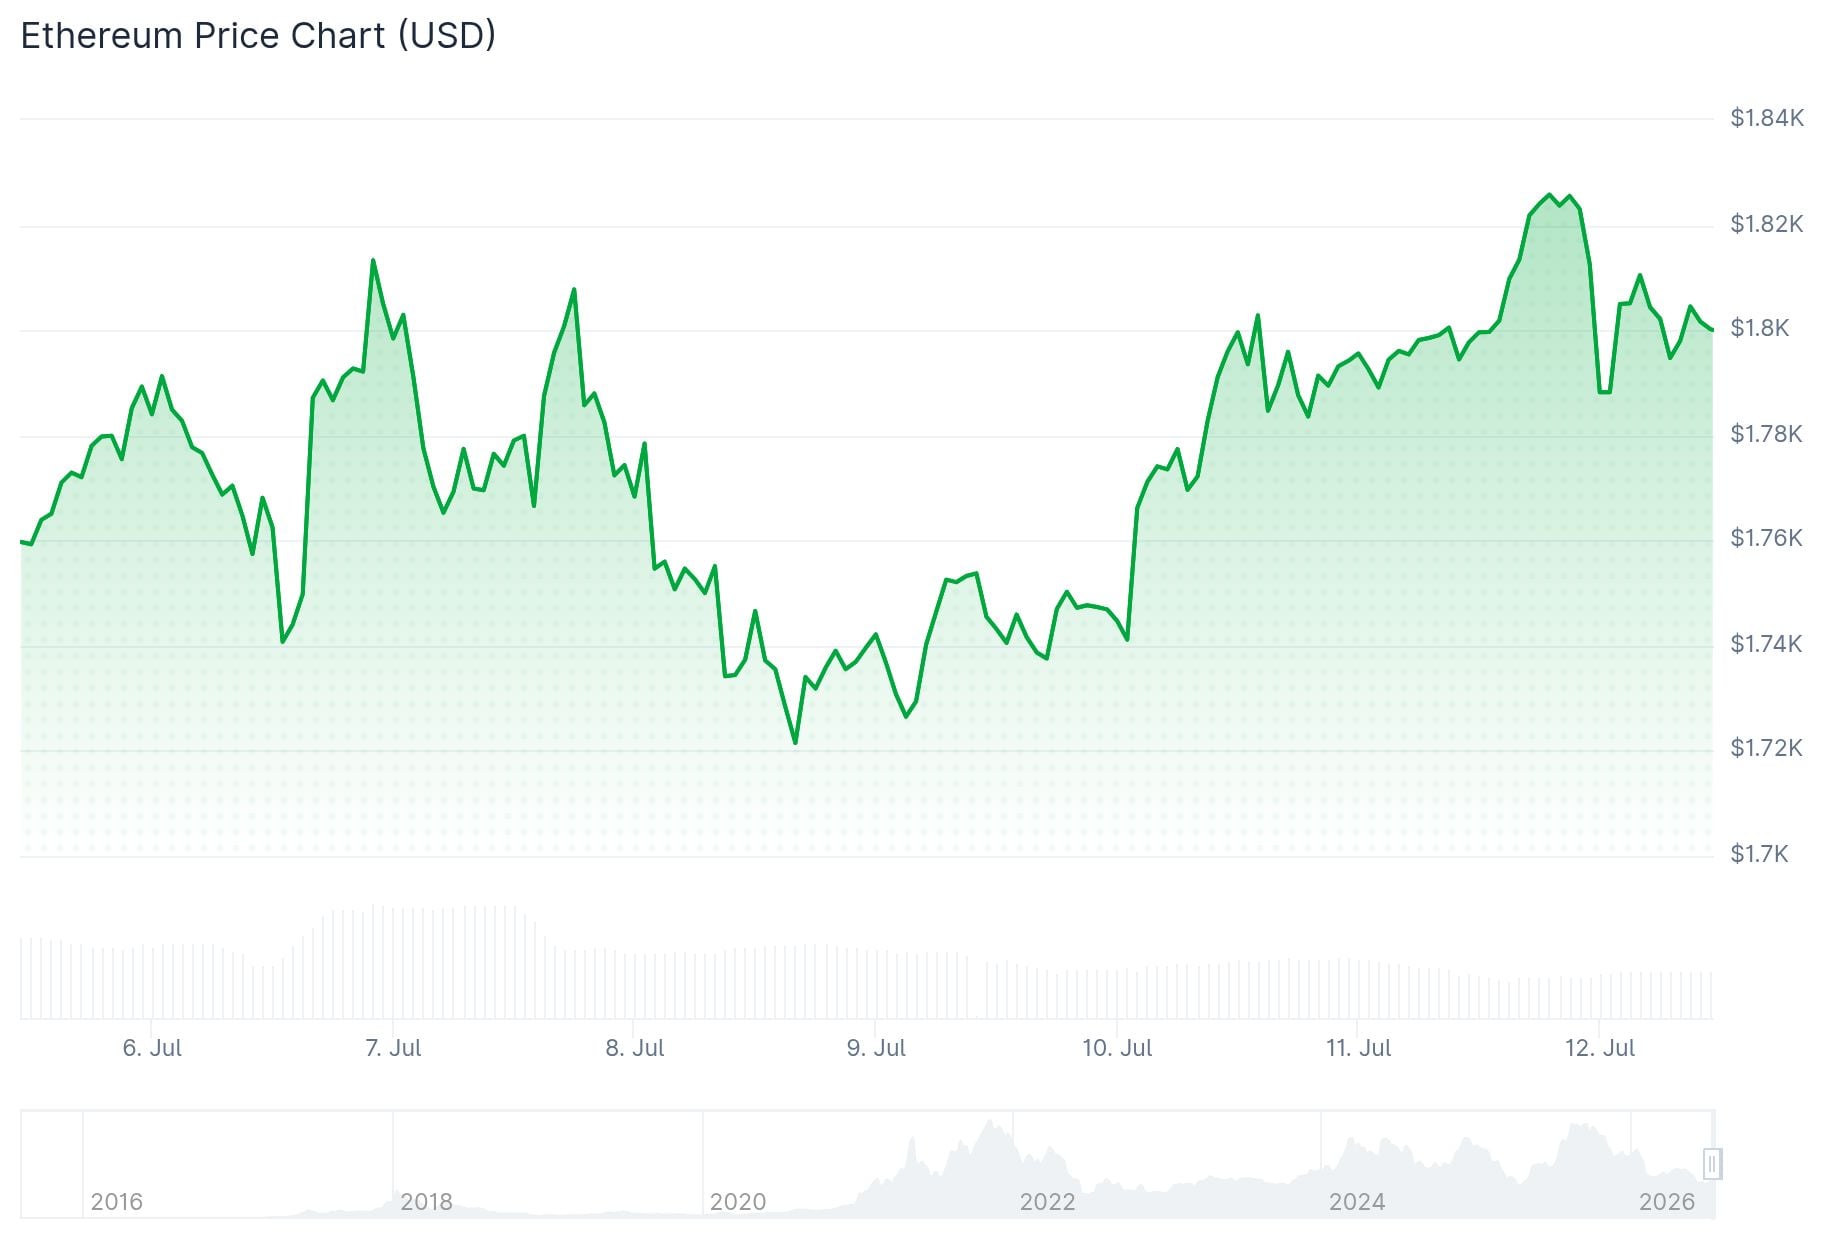
The price action has formed a double-bottom pattern, with the two lows sitting near $1,517 and the neckline at $1,815. This is a pattern that traders often watch as a sign of a trend reversal.
Ethereum has also moved above its 25-day Exponential Moving Average. The Percentage Price Oscillator lines are rising and approaching a zero-line crossover, which is another technical signal traders follow.
Ethereum’s Market Value to Realized Value ratio has dropped below 0.8. The last times this happened were December 2018, March 2020, and June 2022 — all periods that turned out to be long-term price bottoms.
ETHEREUM IS OVERSOLD!
On-chain data reveals the ETH MVRV ratio has officially dipped below 0.8, putting it into deep accumulation territory.
Historically, falling below this 0.8 MVRV level signals seller exhaustion, as aggregate market value falls significantly below total… https://t.co/LNkygeXO5n pic.twitter.com/jGhaQlV8fp
— Ali Charts (@alicharts) July 10, 2026
This reading suggests ETH may currently be trading below its realized value. Long-term investors have historically used these periods to accumulate rather than sell.
Analyst Aksel Kibar, CMT, posted on X that the ETH short-term bottom reversal pattern looks clean, calling out a possible short-term double bottom — matching what the charts are showing.
$ETH short-term bottom reversal pattern is clean. Possible short-term double bottom.
More with Monday's special #cryptocurrency report >> https://t.co/3PXD6BGq77 pic.twitter.com/qKlZhdfUll
— Aksel Kibar, CMT (@TechCharts) July 12, 2026
After eight straight weeks of outflows, spot Ethereum ETFs brought in over $84 million this week. While not a large number on its own, the direction of the change is what analysts are watching.
Tom Lee’s BitMine (NASDAQ: BMNR) has been one of the most active buyers. The company purchased ETH worth over $35 million this week alone and now holds 5.74 million ETH, approaching the 6 million milestone.
The Crypto Fear and Greed Index also moved from 15 (extreme fear) to 31, a shift that has historically lined up with price recoveries across Bitcoin and Ethereum.
$ETH as beaten down as this has been, this is still a decent overall area. This + Robinhood activity makes eth look pretty attractive in the short term and I can see this going to 2500ish if btc remains stable pic.twitter.com/XIuPURox4d
— Altcoin Sherpa (@AltcoinSherpa) July 11, 2026
For ETH to confirm the move toward $2,000, it needs to hold above $1,817 and break through resistance in the $1,820–$1,850 range. If that level flips to support, the next targets are $1,950 and then $2,000.
If ETH fails to hold $1,730, the recovery could stall and consolidation may continue.
The post Ethereum (ETH) Price: Wall Street Is Buying Again — and the Charts Are Starting to Agree appeared first on CoinCentral.





