TL;DR
PEPE is trading at $0.00001135, up 4% over the past 24 hours and 7% weekly. Daily trading volume is close to $958 million, showing strong market participation.
On the chart, PEPE is forming a symmetrical triangle, a structure that often develops during periods of price compression. The asset has been making lower highs and higher lows over several months, tightening the range. The most recent level of $0.00001087 places the token close to the triangle’s apex.
Analyst Ali Martinez posted, “$PEPE readies for a 78% price move!” referring to the current chart setup. Symmetrical triangles typically precede sharp moves, but direction remains unclear until a breakout or breakdown is confirmed.
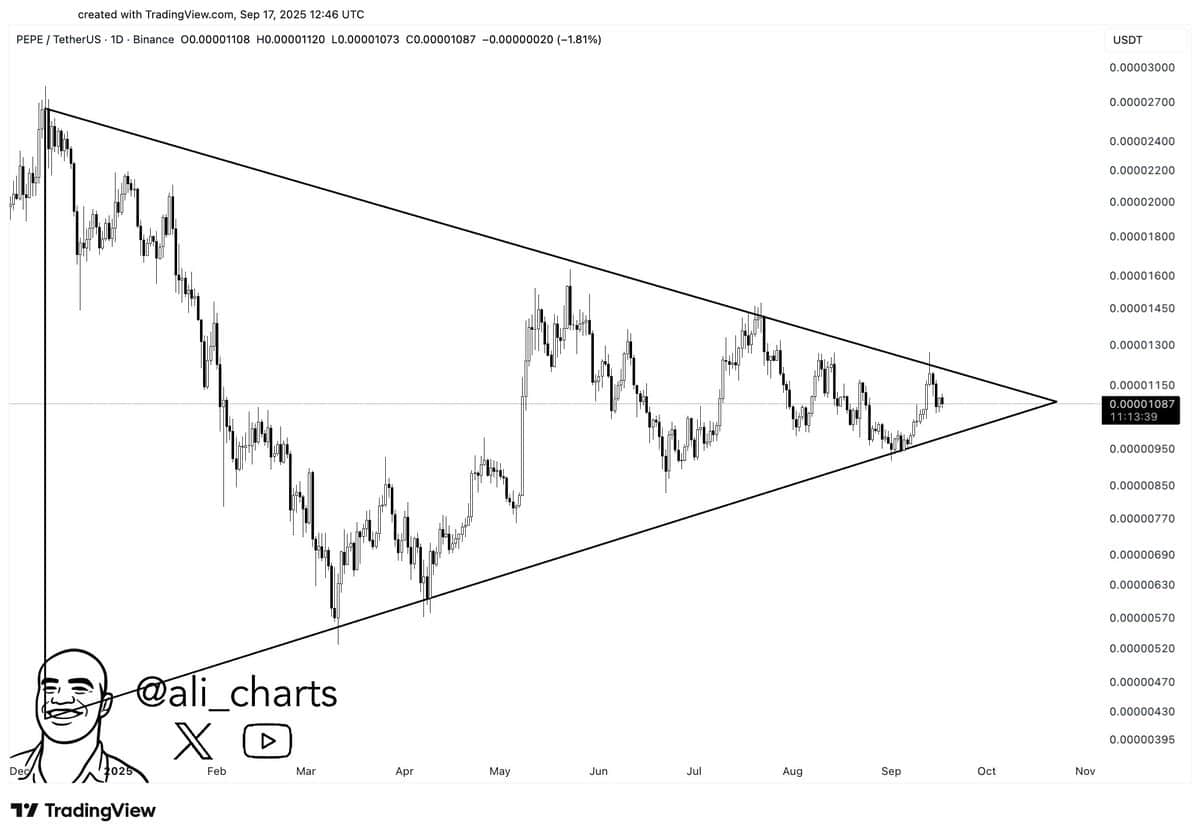
Breaking above the triangle upper trendline could increase the momentum toward the $0.00001800-$0.00002000 range. Upon breakdown, the previous support near $0.00000630 could come into perspective. Until then, the market continues to trade within this narrowing range.
According to CryptoLycus, PEPE is forming a pattern that looks similar to one seen in late 2024. At that time, the price broke out of a wedge and gained over 260%. Lycus commented,
$PEPE is currently forming a very similar bullish wedge pattern to the one we saw last time which led to a massive +200% breakout
The structure is forming again and history shows how explosive these setups can be once the resistance breaks. A breakout from here could easily… pic.twitter.com/0sbksS3R0n
— LaCryptoLycus (@CryptoLycus) September 17, 2025
A similar wedge has formed again in recent months. The asset is currently near $0.00001093, just under resistance. The projected move, based on previous behavior, could reach up to $0.00002837, or more than 300% from current levels, if confirmed.
According to data from CoinGlass, PEPE is trading at $0.00001138, close to a zone where short liquidations begin to build. The chart shows heavy clusters of leveraged short positions between $0.0000119 and $0.0000128. If the price pushes into this range, many short positions could be forced to close, creating conditions for a short squeeze.

On the downside, cumulative long liquidation levels appear more concentrated below $0.0000103, but the exposure tapers off as the price moves lower. This suggests fewer long positions are at risk compared to shorts above current levels. As a result, an upside breakout above resistance carries greater potential to trigger liquidations and add momentum to buying pressure.
The post Will PEPE Rocket 78%? Analyst Predicts Major Move appeared first on CryptoPotato.

