Solana has faced downward pressure over the past week, declining 14% from recent highs. The cryptocurrency struggled to maintain momentum after reaching a cycle high of $206 on July 22.
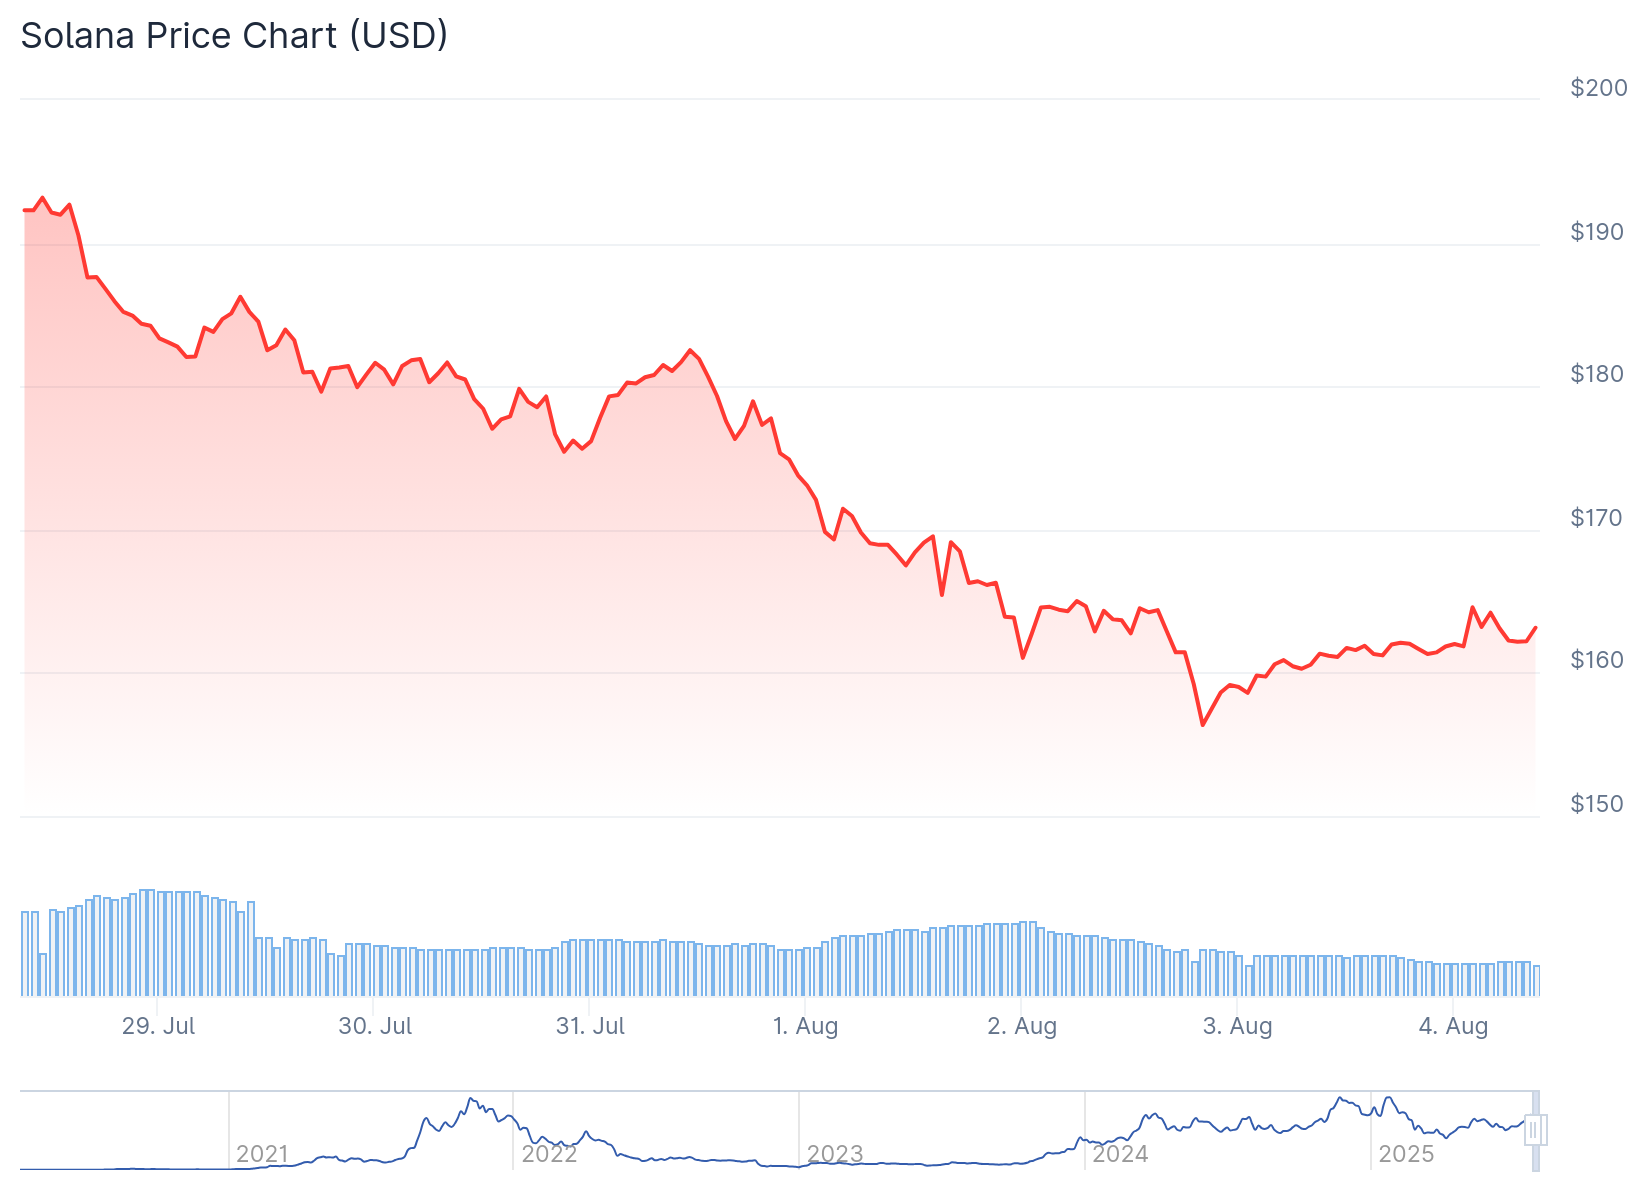
Solana price currently trades at $160.55, testing a crucial support level at $158.80. Short-term investor confidence has weakened as the price action disappointed many traders.
Despite the price decline, on-chain data reveals a different story unfolding behind the scenes. Long-term holders are taking advantage of the lower prices to increase their positions.
Glassnode data shows a 102% surge in Hodler Net Position Change since July 30. This metric tracks the 30-day net change in holdings by long-term participants.

The increase indicates more coins are moving into cold storage rather than being sold. This behavior suggests strategic positioning by experienced investors who view current prices as attractive entry points.
The Liveliness metric has steadily declined since July 25, reaching a weekly low of 0.76. This measurement tracks the movement of previously dormant tokens.
When Liveliness falls, it indicates that long-term holders are moving assets off exchanges and choosing to hold. The metric confirms reduced selling activity among seasoned SOL investors.
The Realized Profit/Loss Ratio dropped to 0.15 on August 2, marking its lowest point in 30 days. This figure shows that most recent sellers exited their positions at a loss.

Such capitulation-style events often occur near cycle bottoms in cryptocurrency markets. When traders sell at losses, it typically indicates panic selling has reached extreme levels.
With fewer holders willing to sell underwater positions, downward pressure on the price may begin to ease. Historical patterns suggest these moments can mark the final phase of a drawdown.
The Relative Strength Index sits at 41.65, approaching oversold territory. This level suggests the selling momentum may be losing steam.

On-Balance Volume has flattened after a steady decline, indicating that selling volume is decreasing. While not yet signaling a reversal, the data shows sellers are becoming exhausted.
The daily price chart shows SOL struggling below the $165 level. However, recent candles hint at a potential pause in the downward movement.
If buying pressure increases, SOL could target the $176.33 resistance level. This would represent a meaningful recovery from current levels.
Should the $158.80 support fail, the next potential floor sits at $145.90. This level would mark a deeper correction for the cryptocurrency.
Market participants are watching these key levels closely. The support at $158.80 faces a serious test as trading continues.
Long-term holders continue their accumulation strategy despite the price weakness. Their behavior suggests confidence in SOL’s future prospects.
The current price action reflects broader cryptocurrency market conditions. Many digital assets have experienced similar pressure in recent weeks.
Trading volume patterns support the thesis that selling pressure is decreasing. This could create conditions for price stabilization in the near term.
Long-term holders increased their SOL positions by 102% since July 30, showing confidence despite the 14% weekly price decline.
The post Solana (SOL) Price: Long-Term Holders Accumulate Despite 14% Weekly Drop appeared first on CoinCentral.

