Solana is holding steady above $75 as technical patterns and institutional inflows point to cautious optimism. SOL traded at $75.27 at the time of writing, with a 24-hour volume of around $2.27 billion and a market cap of approximately $43.86 billion. The token declined about 0.1% in the last 24 hours.
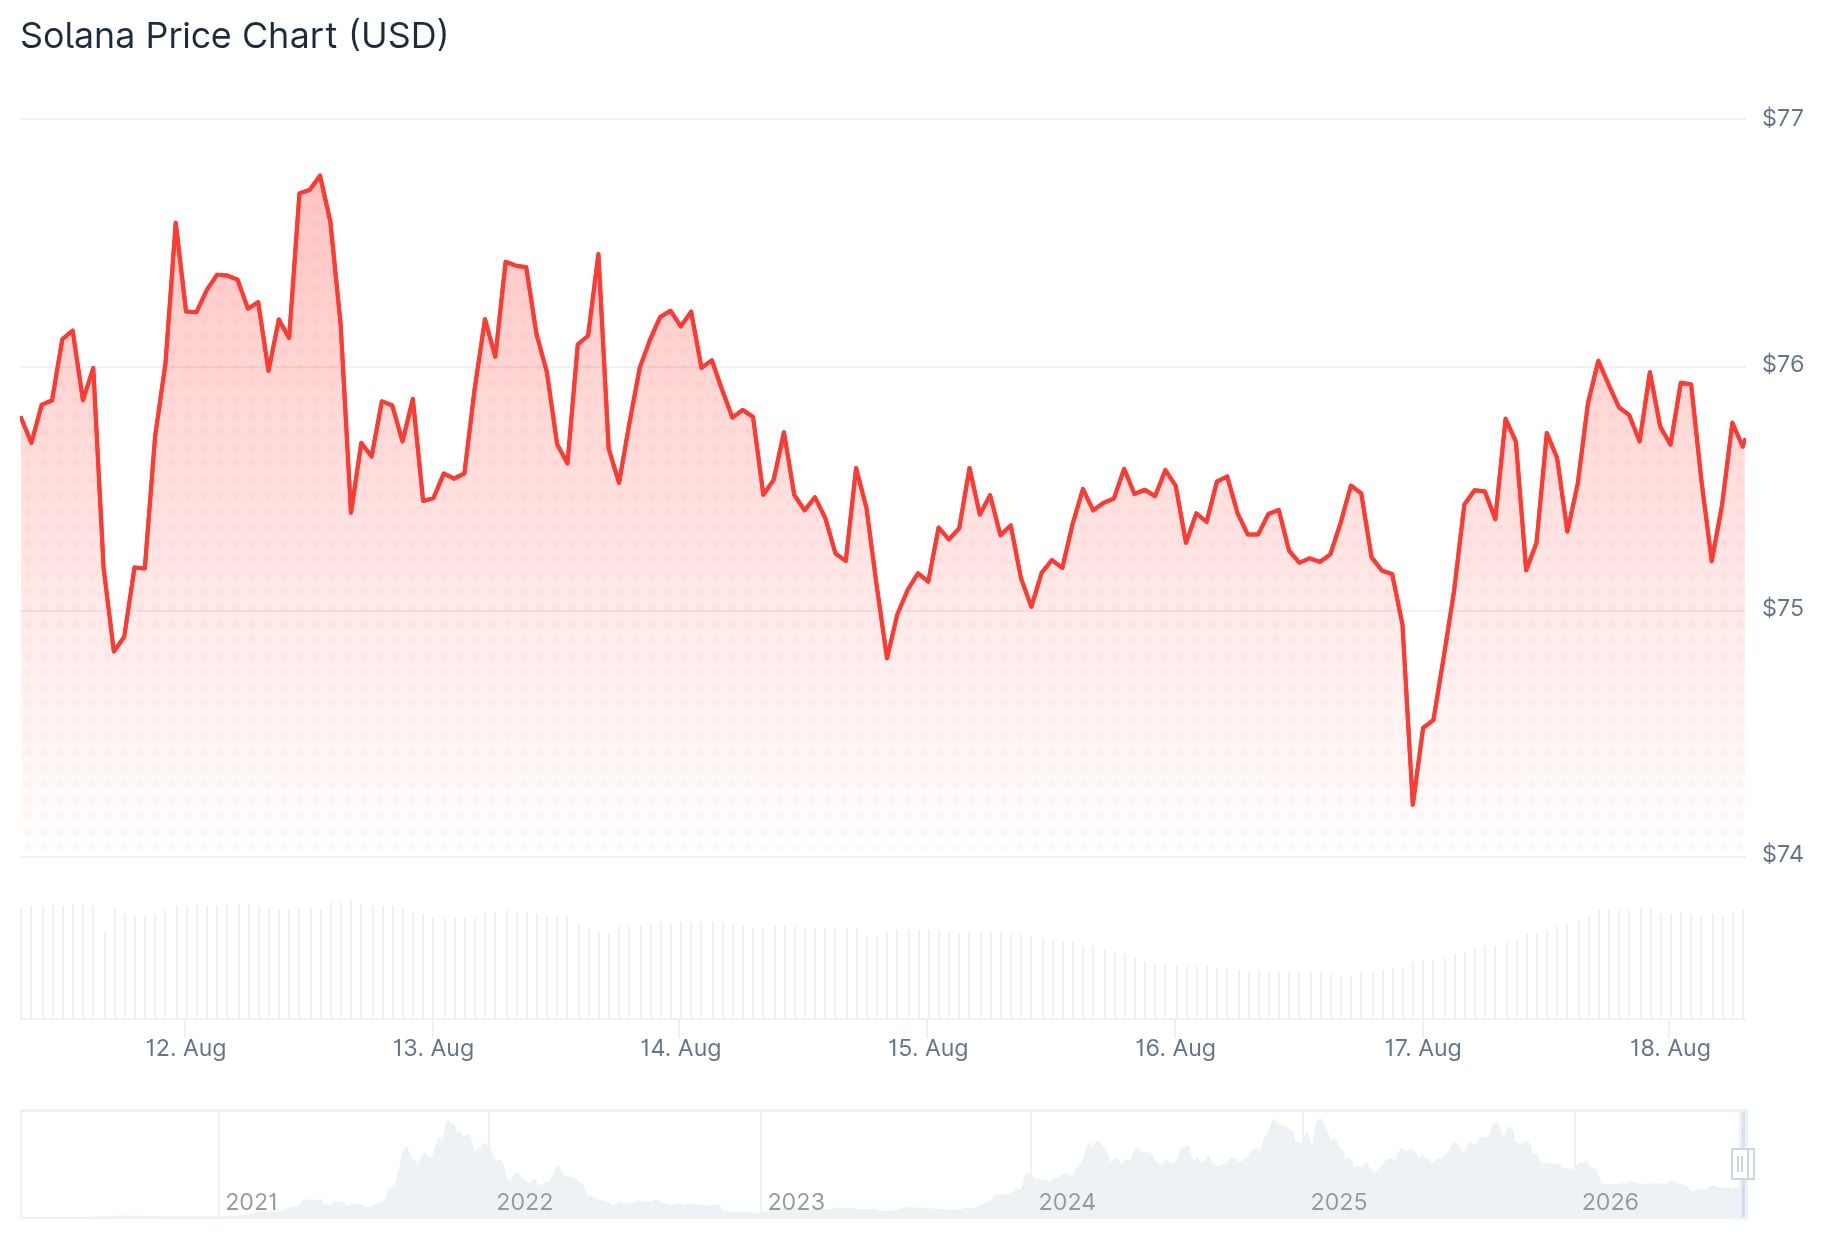
The price has found support at an ascending trendline after slipping 2.18% last week. SOL is trading just above the 50-day Exponential Moving Average (EMA) at $75.48.
Analyst Bluntz, posting on X, noted “strong pa on $SOL,” adding that the token has been “somewhat boring” because it’s likely still in an accumulation phase. He pointed to a weekly bullish divergence that he believes may be marking the bottom.
strong pa on $SOL here, liking it alot, its been somewhat boring because we are likely still in an accumulation period but ppl have already conveniently forgotten theres a weekly bull div there likely marking the bottom pic.twitter.com/WQZCJ4zaOG
— Bluntz (@Bluntz_Capital) August 11, 2026
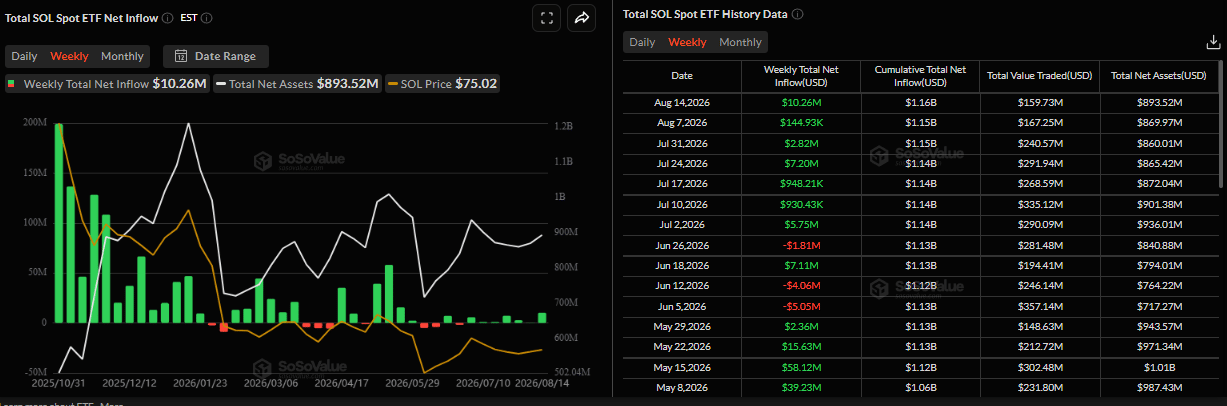
Institutional demand has remained steady. According to SoSoValue data, US-listed spot SOL ETFs recorded $10.26 million in inflows last week. That was the highest weekly figure since May 22 and marked the seventh consecutive week of positive inflows.
CryptoQuant data also shows a mild bullish lean, with large whale orders visible in spot markets and cooling conditions in futures. Other on-chain metrics remain neutral.
The 100-day EMA sits at $78.10, and the 200-day EMA is further up at $88.69. Both act as overhead resistance, keeping the broader trend range-bound for now.
On August 17, analysts at Alpha Crypto Signal flagged a falling wedge forming on SOL’s 4-hour chart. The pattern shows prices trading between two descending trendlines with a narrowing range — a setup that often precedes a breakout to the upside.
Thoughts on #SOL:$SOL is forming a falling wedge on the 4H chart, with price compressing between descending trendlines. The recent bounce from the lower boundary keeps the setup interesting, but confirmation is still needed.
A clean breakout above the upper trendline could… pic.twitter.com/RBWgi1JTu1
— Alpha Crypto Signal (@alphacryptosign) August 17, 2026
SOL is currently trading near the mid-Bollinger Band at $74.50. The upper band sits at $77.10 and the lower at $71.91.
The MACD histogram stands at 0.10329 with the MACD line at 0.05374 and the signal line at -0.04955, showing improving momentum.
A clean break above the upper trendline of the wedge, backed by increased volume, would set $77.10 as the first upside target. Failure to hold $74.50 would weaken the near-term setup and put $71.91 in focus.
SOL has yet to confirm a breakout move. The next few sessions will be key in determining direction.
The post Solana (SOL) Price: ETF Inflows Drive Seven-Week Streak as Bullish Chart Pattern Forms appeared first on CoinCentral.





