Solana (SOL) is trading at $75.55 on Monday, up around 0.20% in the past 24 hours. The market cap sits at roughly $44.03 billion, with daily trading volume near $629 million.
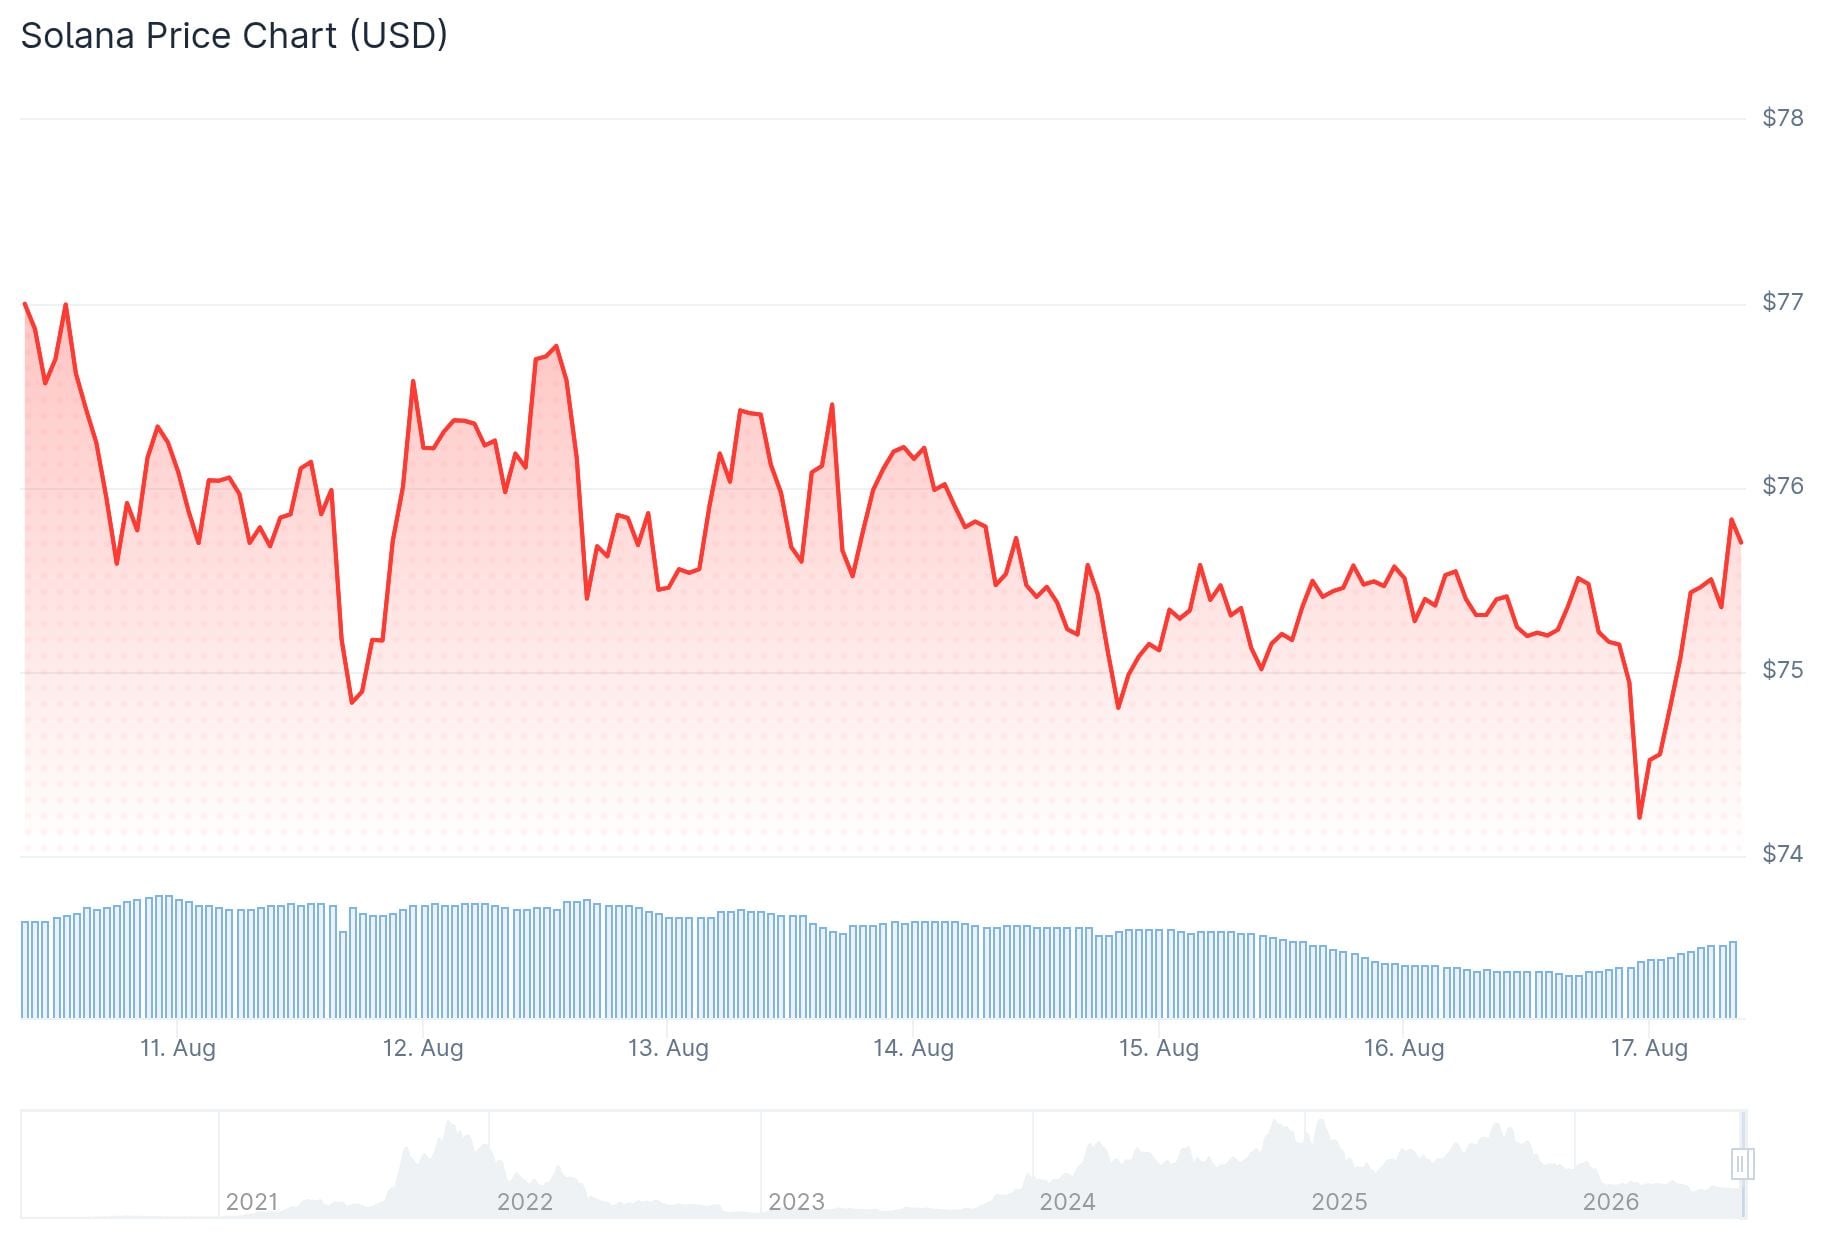
SOL dropped 2.18% last week but found support at an ascending trendline. Price is now consolidating just above the $73-$75 support zone that analysts are closely watching.
Institutional demand has stayed steady. SoSoValue data shows SOL spot ETFs pulled in $10.26 million last week. That marks the seventh straight week of positive inflows and is the highest weekly figure since May 22.
CryptoQuant data also shows a mild bullish lean. Large whale orders are visible in spot markets, while futures markets show cooling conditions. Other metrics remain neutral.
On the technical side, SOL is holding just above its 50-day EMA at $75.48. It remains below the 100-day EMA at $78.10 and the 200-day EMA at $88.69.
The RSI sits near 52, a neutral reading. The MACD is holding in positive territory, suggesting some stabilization in demand without a strong directional signal yet.
Analyst Alex Marzell points out that SOL has already been rejected from the $78-$80 area multiple times. Each failed test has led to a pullback, making this zone the key short-term test for buyers.
$SOL IS GETTING REJECTED AGAIN. 🩸
This resistance has already been tested multiple times, and SOL is now facing rejection #2.
The first rejection sent price lower.
If this one confirms as well, $60–61 becomes the next major demand zone.
SOL needs to reclaim $78–80 to… pic.twitter.com/7hmW9lJItq
— Alex Marzell (@MarzellCrypto) August 15, 2026
If selling pressure returns and SOL loses the $73 level, Marzell identifies $60-$61 as the next major support area.
Analyst Astekz described price action as choppy but technically positive. SOL is attempting to break away from a descending trendline while holding its horizontal support base.
Analyst Eliz notes that SOL is trading above the Ichimoku Cloud on the 4-hour chart, which supports the current consolidation above the $73-$75 breakout zone.
Analyst ray has identified a symmetrical contracting pattern on the Solana chart. A confirmed breakout from this structure targets around $113, with $100 acting as the first major psychological level.
Crypto analyst KillaXBT shared on X that once Bitcoin finds a bottom, a 100–150% move for SOL is “absolutely in play,” though he stopped short of calling new all-time highs certain.
Slowly… then all at once.
We might not see $SOL print new ATHs, but once $BTC bottoms, a 100–150% move from here is absolutely in play. https://t.co/PyIB7WrzoZ pic.twitter.com/qLYX8nDGSi
— Killa (@KillaXBT) August 13, 2026
Longer-term, analyst Sweep projects SOL could trade near $200 by 2027. The forecast is tied to regulatory clarity, real-world asset tokenization growth, stablecoin adoption, and continued Solana memecoin activity.
The chart Sweep shared identifies $179 as an intermediate Fibonacci level before a broader $212 target region.
SOL currently trades at $75.55, with the $78-$80 resistance and $73 support as the two levels traders are watching most closely right now.
The post Solana (SOL) Price: SOL Holds Steady as ETF Inflows Continue and Analysts Eye $100 Breakout appeared first on CoinCentral.





