Solana price action has captured trader attention as the cryptocurrency builds momentum above the $210 support level. The digital asset has posted a 7% gain over the past week, outpacing Bitcoin and Ethereum in recent trading sessions.
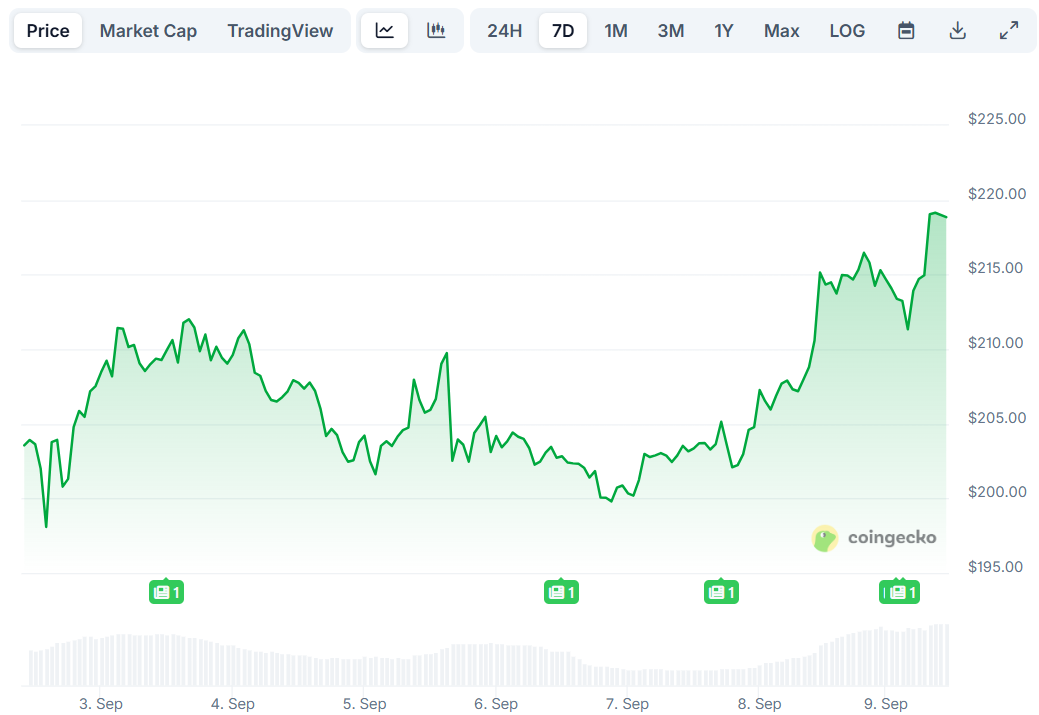
SOL started its latest rally after finding solid support near the $200 zone. The price quickly climbed through the $205 and $210 levels, establishing a foundation for further gains.
Technical indicators point to continued bullish pressure. The RSI has bounced into positive territory at 60, showing buyers remain in control of the current market move. The MACD indicator hovers near a potential golden cross formation, which would confirm longer-term bullish momentum.
Chart analysis reveals SOL testing the upper boundary of a rising wedge pattern that has contained price action since the April market bottom. A support trendline formed throughout August now approaches this key resistance level.
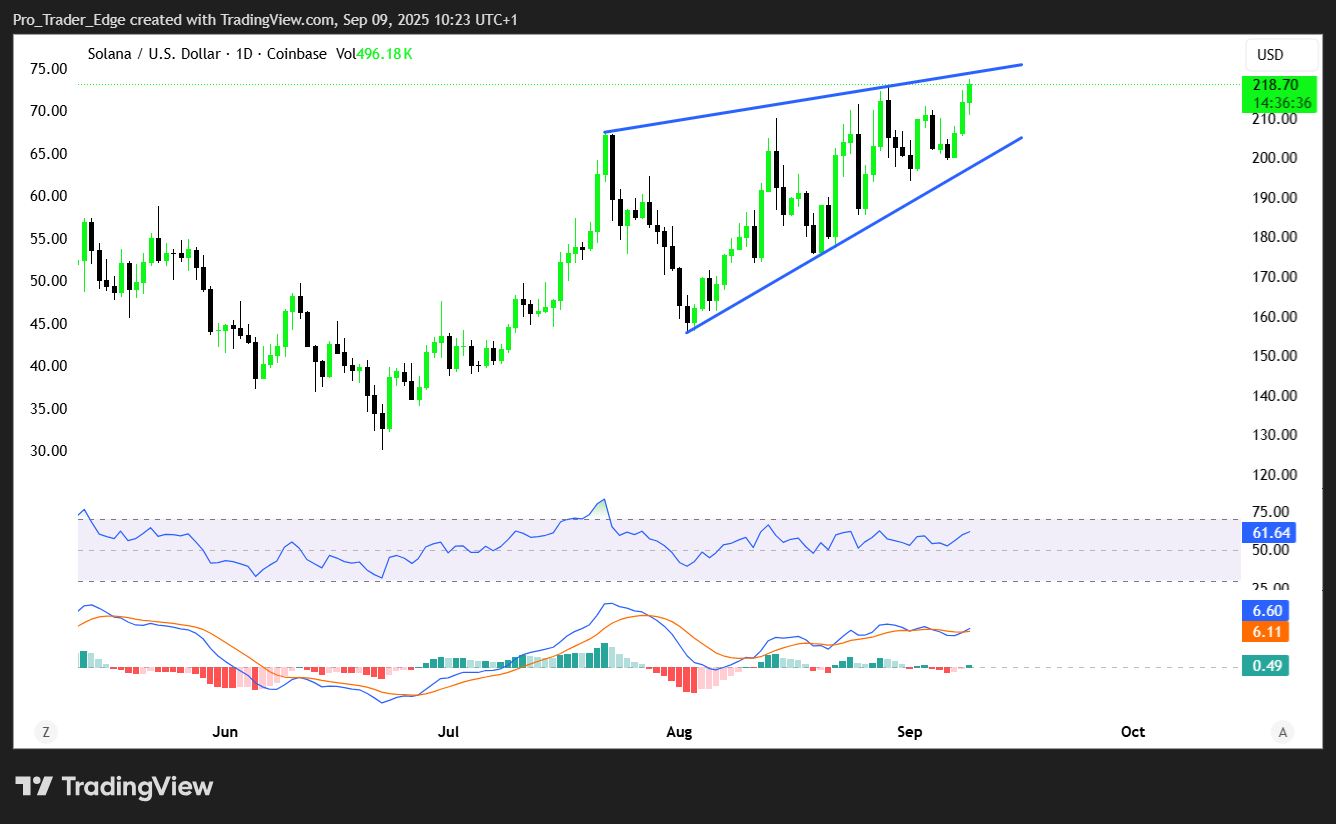
The same structure could also represent an ascending triangle pattern. However, current momentum favors the bullish breakout scenario over a potential 30% pullback to $150 support.
SOL currently faces immediate resistance at the $218 level. A break above this zone opens the path to $220, with the main resistance target at $232.
Successful clearance of the $232 level could trigger steady gains toward $244 and potentially $250. These levels represent key milestones in SOL’s path to higher targets.
October marks a critical month for Solana as spot ETF issuers face their final SEC decision deadline. This regulatory milestone could unlock institutional demand that has remained on the sidelines.
🚨JUST IN: The final deadline for the SEC’s decision on Solana Spot ETF applications is now only 32 days away, with the ruling set for October 10th. pic.twitter.com/LeAeIpflTI
— SolanaFloor (@SolanaFloor) September 7, 2025
The potential ETF approval comes as TradFi integration accelerates across the crypto space. Corporate treasuries have begun including digital assets as exposure vehicles for both institutions and public markets.
The U.S. CLARITY Act adds another layer of regulatory support. This legislation could release sidelined institutional capital once regulatory frameworks become clearer.
A confirmed breakout above current resistance levels could propel SOL to retest its early-year all-time high near $300. With this level reclaimed as support, new price discovery becomes possible.
The next major milestone sits at $500, representing a 135% gain from current levels. This target assumes continued institutional adoption and successful ETF approval.
As the current bull cycle matures, upside potential may extend further. TradFi demand acceleration, including possible Solana ETF approval, could drive SOL toward the $1,000 target.
This ambitious price level represents a 360% surge from current trading ranges. Such gains would require sustained institutional buying and broader market participation.
For now, traders watch the immediate $218 resistance level. A break above this zone with volume confirmation would validate the bullish breakout scenario.
Downside risks remain if SOL fails to clear current resistance. Initial support sits at $212, followed by major support at $208.
A break below $208 could trigger declines toward $204 support. Further weakness might test the $200 level where the recent rally began.
Current price action shows SOL consolidating above $210 and the 100-hourly simple moving average, maintaining its short-term positive bias.
The post Solana (SOL) Price: October ETF Decision Could Drive Breakout To $500 Target appeared first on CoinCentral.


