Solana has entered a bearish phase in recent trading, dropping from the $250 zone and showing signs of continued downward movement. The cryptocurrency is now testing a critical support level at $210 that could determine its next major directional move.
SOL started a fresh decline, breaking below several key price points including $240 and $230. The downward momentum pushed the price below both the $220 level and the 100-hourly simple moving average, establishing a bearish trend in the short term.
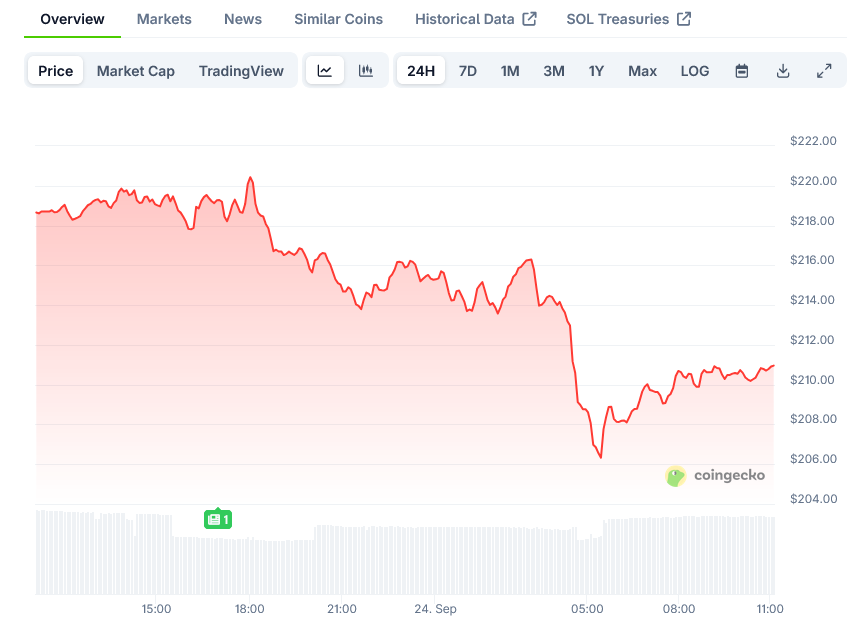
The price reached a local low of $207 and is now consolidating losses below the 23.6% Fibonacci retracement level calculated from the downward move that began at the $254 swing high.
Double buy signal on $SOL from TD Sequential. Defend $210 and $250 comes next! pic.twitter.com/wRrys14sJG
— Ali (@ali_charts) September 23, 2025
Technical analysis shows a bearish trend line forming with resistance at $222 on the hourly chart. This creates an immediate obstacle for any recovery attempt that Solana might make in the coming hours.
If SOL attempts a recovery, it will likely face resistance near $215, followed by stronger resistance at the $220 level or the trend line. The main resistance sits at $230, which corresponds to the 50% Fibonacci retracement level of the recent downward move.
Despite the bearish price action, not all signals point downward. The 4-hour chart displays a TD Sequential double buy signal just as the price approaches the key $210 support zone. This timing could prove significant for determining Solana’s next move.
The TD Sequential indicator has printed both “9” and “13” counts in oversold territory, typically signaling trend exhaustion and potential reversal. This technical pattern often precedes price rebounds.
The $210 support level gains additional importance as it coincides with the 0.618 Fibonacci retracement, creating a confluence of technical support factors that might help hold the price.
A rising channel that has contained SOL’s price action since early August remains intact, providing a structural framework for potential recovery. Within this pattern, the current price action represents a test of the channel’s lower boundary.
If SOL fails to rise above the $222 resistance, downward momentum could continue. Initial support sits near the $207 zone, with major support at the $202 level.
A break below $202 might send the price toward the psychologically important $200 support zone. If Solana closes below $200, the decline could extend toward $184 in the near term.
Conversely, if buyers successfully defend the $210 area, immediate upside targets include $228 resistance, followed by the more significant $250 level. A breakout above $250 could extend the rally toward $263 and eventually the $280-$290 Fibonacci extension zone.
The hourly MACD for SOL/USD is gaining pace in the bearish zone, while the RSI remains below the 50 level, adding to the bearish outlook in the immediate term.
Network activity continues to position Solana as one of the most active Layer-1 ecosystems, hosting major DeFi, NFT, and payment applications. Institutional interest in SOL has been growing, with the asset appearing more frequently in crypto investment products and research reports.
The cryptocurrency now finds itself at a pivotal moment. The current test of $210 support will likely determine whether SOL can resume its upward trajectory or if further downside is in store.
Current momentum appears mixed, with bearish short-term indicators contrasting with potentially bullish reversal signals on longer timeframes. The next 24-48 hours will be crucial as the market decides whether the double buy signal can overcome the bearish trend line.
The price is now trading below multiple technical indicators, suggesting bears maintain control for the time being. However, the emerging buy signals indicate this control might soon be challenged if the $210 support holds firm.
The post Solana (SOL) Price: Bearish Trend Line Forms with Resistance at $222 appeared first on Blockonomi.


