Solana (SOL) is under pressure after failing to break through the $93 resistance level. The token has since pulled back and is now sitting near a key support zone that traders are closely watching.
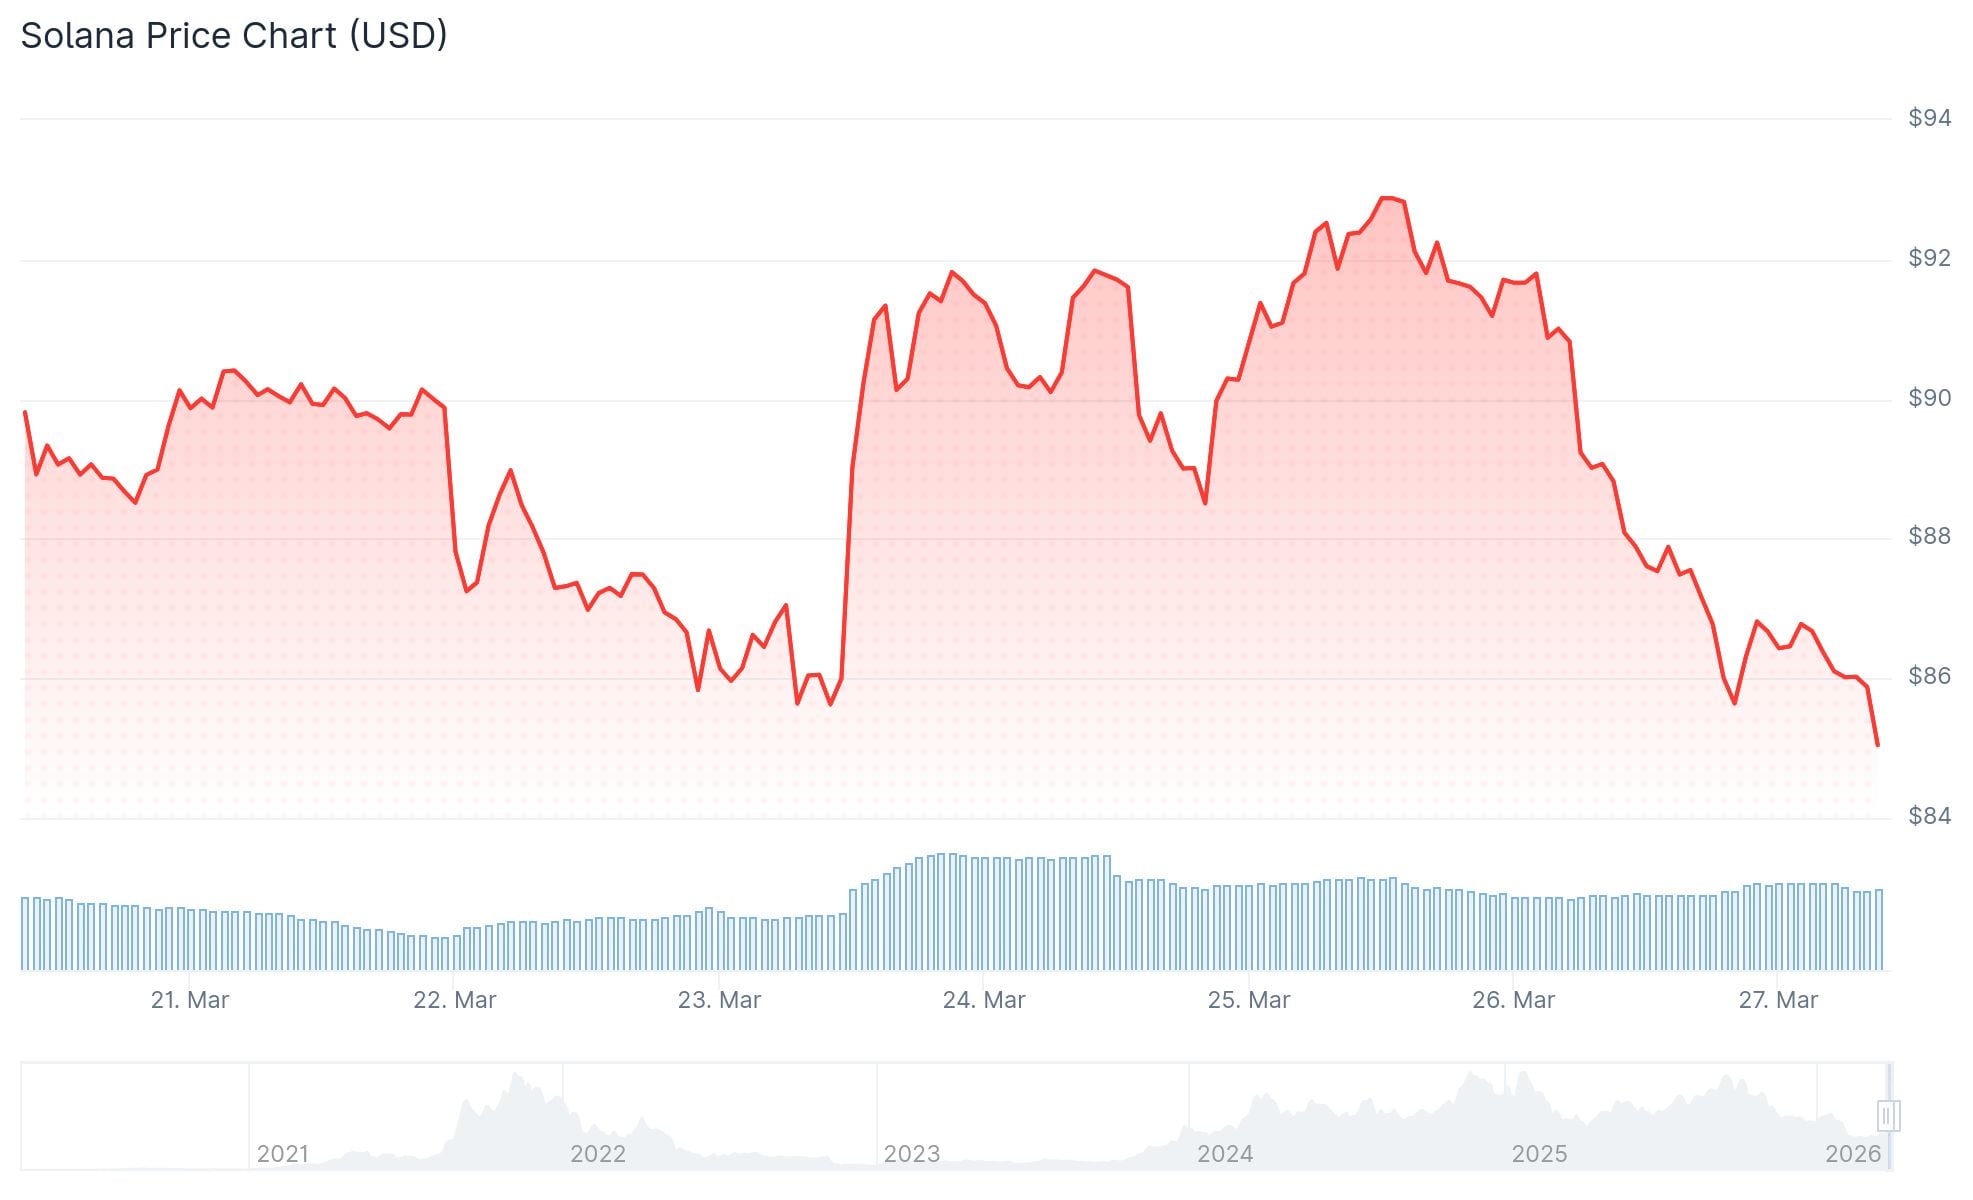
At the time of writing, SOL is trading at $87.45. Trading volume over the last 24 hours came in at $5.62 billion, and the total market cap sits at $50.21 billion. The price has dropped 5.70% in the past day.
The rejection at $93 was flagged by crypto analyst BitGuru in a post on X on March 26, 2026. According to the analyst, SOL has returned to a historically important support zone after failing to push through resistance. What happens at this level could set the direction for the next price move.
If buyers step in here, SOL could attempt a bounce toward higher resistance levels. If the support zone breaks, further downside may follow.
Solana is currently trading below all of its major moving averages. The 20-day moving average is at $88.63, the 50-day is at $86.09, the 100-day sits at $106.54, and the 200-day is at $143.24.
Being below the 100- and 200-day moving averages shows the coin is far from any sustained bullish momentum.
The RSI stands at 47.66, below its signal line of 52.54. The MACD line is at 0.127, below its signal line of 0.232. The flat MACD histogram points to low directional conviction in either direction.
On the daily chart, an analyst has identified a bearish flag pattern forming — a setup similar to one seen earlier this year. In that prior case, Solana broke down sharply after the pattern completed.
$SOL is repeating the same bearish flag pattern again.
Last time this setup formed → -54% crash. Now the same structure is playing out.
If this breaks down, $SOL could drop to $45–$40 within 1–2 weeks. Are you prepared for this move? pic.twitter.com/AH2XtnIQrJ
— Crypto Lens (@crypto_lens_) March 26, 2026
The current formation shows price compressing in an upward-sloping channel after a steep drop. If a breakdown is confirmed from current levels, the projected move could target the $40 to $45 range within one to two weeks.
That’s a big one https://t.co/VsgRa5uZzF
— toly
(@toly) March 26, 2026
Despite the price weakness, Solana’s network activity remains strong. The chain processed 825,729,338 transactions out of 1,867,616,231 total blockchain transactions during the measured period — accounting for 44% of all global crypto activity.
Over 100 million Solana $SOL were transacted between $91.45 and $82.60, making this the most important demand zone.
Below it, key levels to watch are $53.10, $35.40, and $23.60. pic.twitter.com/RzeTZ6fQeb
— Ali Charts (@alicharts) March 26, 2026
Crypto analyst Ali Charts noted on X that over 100 million SOL were transacted between $91.45 and $82.60, calling it the most important demand zone. Below that, key levels to watch are $53.10, $35.40, and $23.60.
The post Solana (SOL) Price: Rejection at $93 Puts SOL Under Pressure as Bearish Flag Forms appeared first on CoinCentral.


