Solana (SOL) has begun to show signs of recovery after a period of downward price action that saw the cryptocurrency test the $195 support zone. The fourth-largest cryptocurrency by market capitalization is now attempting to regain momentum as bulls push for control of the market.
The price action follows a pattern similar to other major cryptocurrencies like Bitcoin and Ethereum, which have also experienced recent volatility. SOL traded below several key support levels, including $200 and $195, which temporarily placed it in what analysts consider a short-term bearish zone.
SOL reached a low point of $194 before the current recovery attempt began. Since hitting this low, the price has managed to climb back above the $198 and $200 resistance levels, indicating renewed buyer interest in the market.
Technical analysis shows that SOL has surpassed the 23.6% Fibonacci retracement level of the downward move from the $218 swing high to the $194 low. This is often considered a positive sign for short-term price action.
An important technical development occurred when SOL broke above a connecting bearish trend line with resistance at $201 on the hourly chart. This breakout suggests that sellers may be losing their grip on the market.
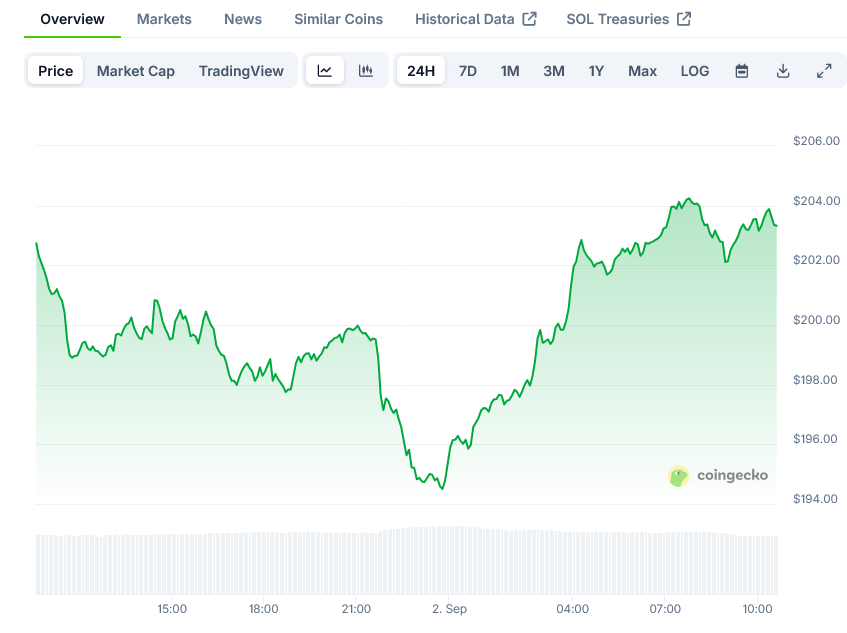
Despite these positive developments, Solana still faces several hurdles before a full recovery can be confirmed. The price is currently trading below $205 and the 100-hourly simple moving average, which remains a key technical indicator watched by traders.
The immediate resistance for SOL appears to be near the $202 level. Beyond this, the $205 level represents a more substantial barrier, corresponding to the 50% Fibonacci retracement level of the recent downward move.
If buyers can push the price above $205, the next major resistance would be at $209. A successful close above this zone could set the stage for a stronger recovery phase. Should this occur, the next target for bulls would be the previous swing high at $218.
If SOL fails to overcome the $205 resistance, the recovery may stall and lead to another decline. The initial support on the downside is near the $200 zone, which aligns with a psychologically important level for traders.
Below this, the $195 level stands as the first major support. A break under this level could expose SOL to further selling pressure, potentially sending the price toward the $188 support zone.
Should bears manage to push the price below $188, the next support level to watch would be $184. Technical indicators currently show mixed signals.
The hourly MACD (Moving Average Convergence Divergence) for SOL/USD appears to be gaining momentum in the bullish zone. This suggests increasing positive momentum in the short term.
The hourly RSI (Relative Strength Index) for SOL/USD is positioned above the 50 level, indicating that buyers currently have a slight edge in the market.
Trading volume has shown moderate increases during the recovery phase, though it remains below the levels seen during the previous rally that took SOL to $218.
The short-term price action for Solana will likely depend on whether bulls can maintain the current recovery momentum and break above the key resistance levels at $205 and $209.
Recent market data shows that SOL price is attempting to establish a new support base above $200 as traders await clearer directional signals.
The post Solana (SOL) Price: Recovery Underway After Testing $195 Support Level appeared first on Blockonomi.


