Sui (SUI) is trading at $0.6761 as of August 17, 2026, hovering just above a key technical support zone. The token is down 87.3% from its all-time high of $5.35, reached in January 2025.
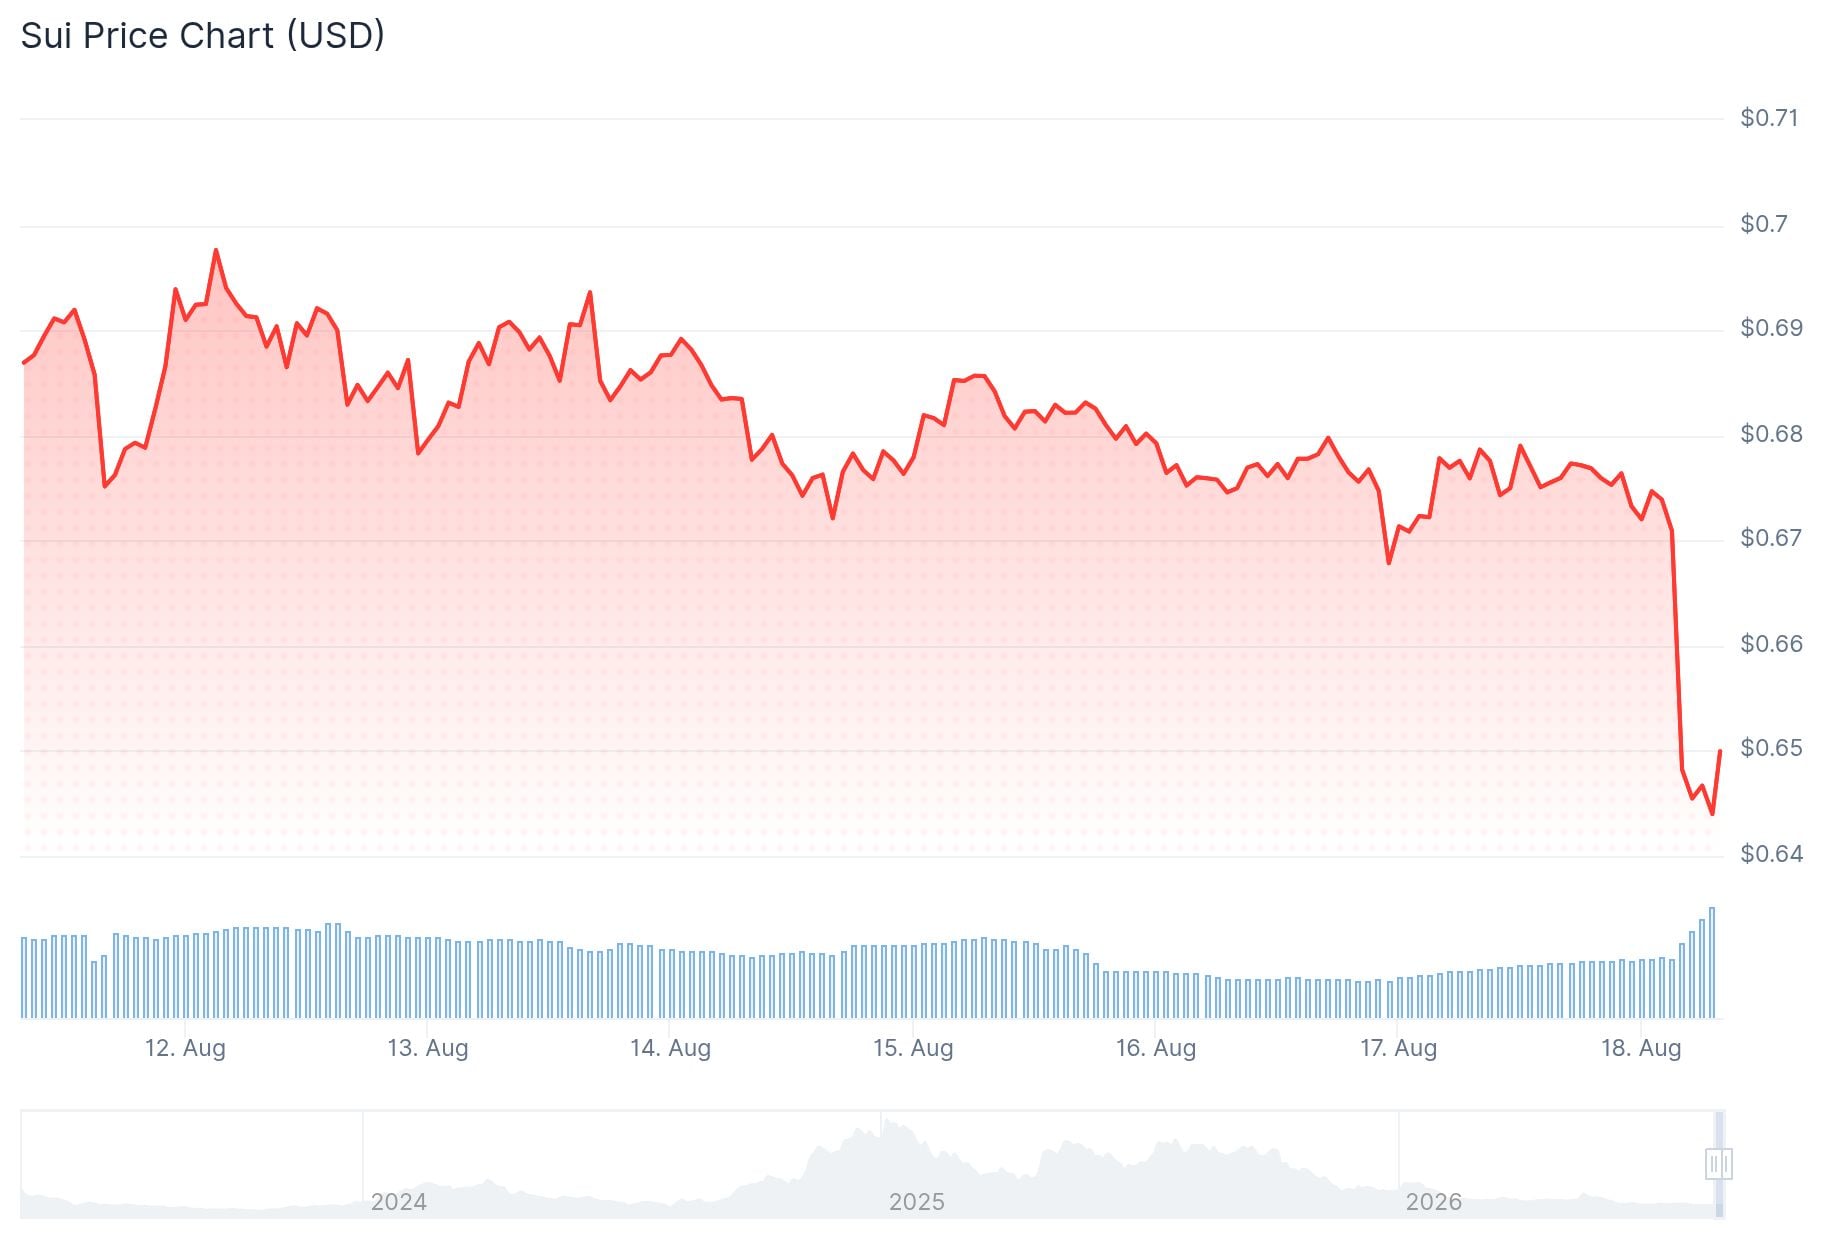
The 24-hour trading volume sits at around $159.44 million, and the market cap is approximately $2.75 billion. SUI has been consolidating in the $0.67–$0.77 range since early June.
Crypto analyst Michaël van de Poppe posted on X that he views SUI as “an ideal spot to be accumulated.” He outlined two scenarios for the token’s next move.
I've said it a few times, I think that $SUI is an ideal spot to be accumulated.
Two scenarios for me here.
1⃣ – This recent sweep of the low will end up with a HL at $0.6725 and we'll break upwards quickly in the coming days, in which I'm targeting $0.745 as the potential… pic.twitter.com/5ITEL49p7h
— Michaël van de Poppe (@CryptoMichNL) August 17, 2026
In his first scenario, the recent dip forms a higher low at $0.6725. If that level holds, he expects SUI to move up quickly, with $0.745 as a potential resistance zone.
In his second scenario, if Bitcoin weakens and pulls the broader market lower, van de Poppe said he would look to buy SUI below $0.65 for a longer swing trade.
SUI is currently trading below its middle Bollinger Band at $0.68332 and close to the lower band at $0.66844. The upper band sits at $0.69820.
The MACD histogram is slightly positive at 0.00079, and the MACD line at -0.01098 is just above the signal line at -0.01177. This points to mild bullish pressure, though both lines remain below zero.
The On-Balance Volume (OBV) has been flat for over a month, and the RSI has failed to cross above 50. The Stochastic RSI recently formed a bearish crossover, which may signal more downside ahead.
The $0.833 level acts as a supply zone and represents the 23.6% Fibonacci retracement. The golden pocket sits much higher, between $1.12 and $1.25.
Liquidation data from CoinGlass shows a cluster of long liquidations below $0.65, making that area a potential target for a price sweep. Overhead, the $0.78 zone holds another liquidity cluster that lines up with a local supply area.
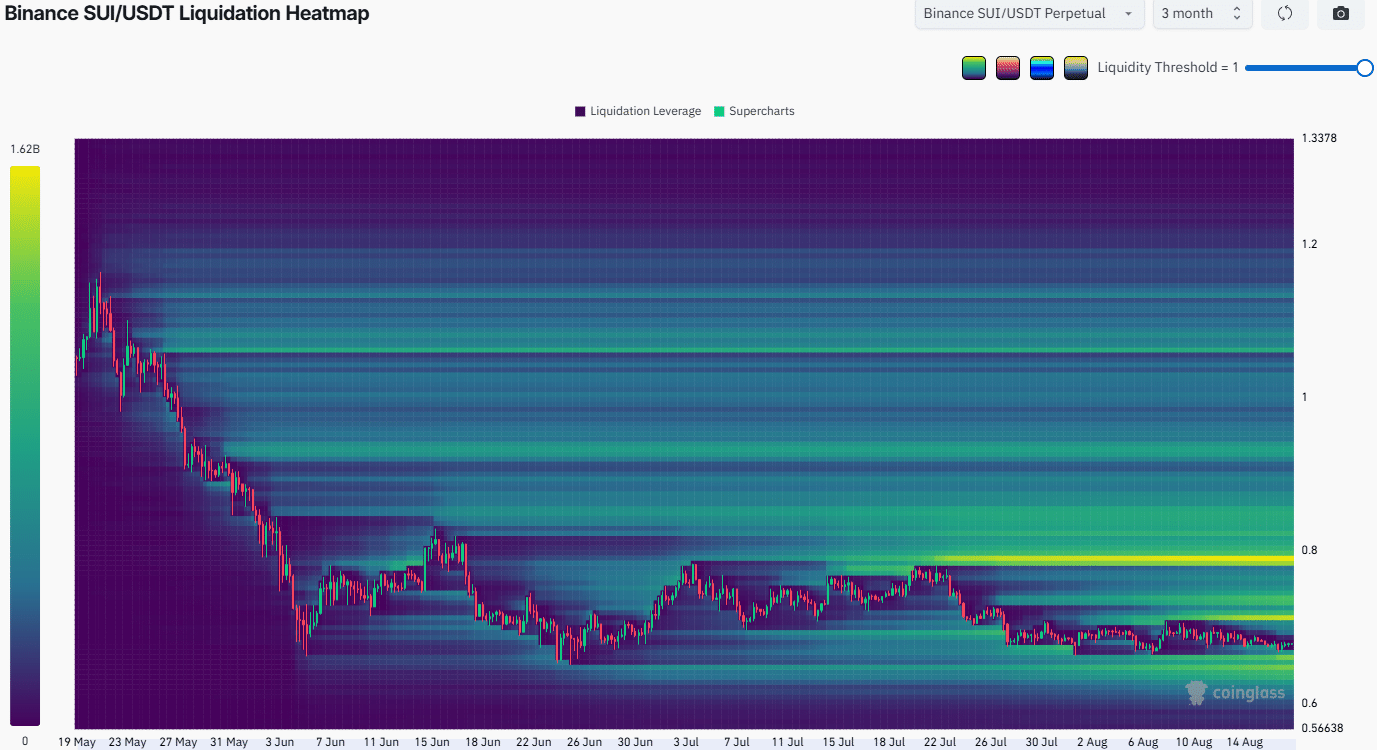
A bounce toward $0.80 is seen as a potential selling opportunity, while a breakdown below $0.64 would point to further losses.
From February to early May 2026, SUI appeared to consolidate in a similar way before a strong rally to $1.42. That move was followed by heavy selling in the weeks after.
SUI needs to break above $0.68332, then $0.69820, to show any improvement in momentum. The $0.745 resistance level cited by van de Poppe remains the near-term upside target.
The post Sui Price: SUI Is 87% Off Its High — Is it Time to Buy? appeared first on CoinCentral.





