Sui’s chart is tightening up, and traders are watching closely. The token’s recent structure shows a bullish pattern that could be gearing up for a big move.
Price action has been coiling after a strong run, creating conditions for a breakout. Analysts are mapping clear targets if momentum takes hold. While the short-term price has dipped, the broader structure is holding steady on higher timeframes.
On higher timeframes, Sui’s chart has been building what looks like a textbook cup-and-handle formation. This pattern formed as the price recovered from a decline, built a rounded bottom, and then paused for a smaller pullback. That pause, the handle, often acts as a staging area before another leg higher.
Following the handle, the price has slipped into a symmetrical triangle. This consolidation shows price swinging between narrowing support and resistance, gradually compressing over time. Such setups often resolve in the direction of the preceding trend, which in this case has been upward.
Do not ignore #SUI
Strong Higher Timeframe structure

Cup & Handle formation, then re-accumulating inside of Symm. Triangle

Compression is over and I am looking for a breakout! Send $SUI to 2 Digits or market is wrong
1 Target – 7.9$
— Alex Clay (@cryptclay) August 12, 2025
Crypto analyst Alex Clay noted that compression inside the triangle appears to be ending. In his view, this signals an imminent breakout that could push SUI into double-digit territory. His chart marks three specific upside targets: $7.9, $9.75, and $11.7.
The targets are based on previous swing highs and Fibonacci retracement levels. The first sits just under $8, likely to be the earliest resistance point. If momentum holds, the next resistance may emerge near $9.75, with the final stretch aiming for $11.7.
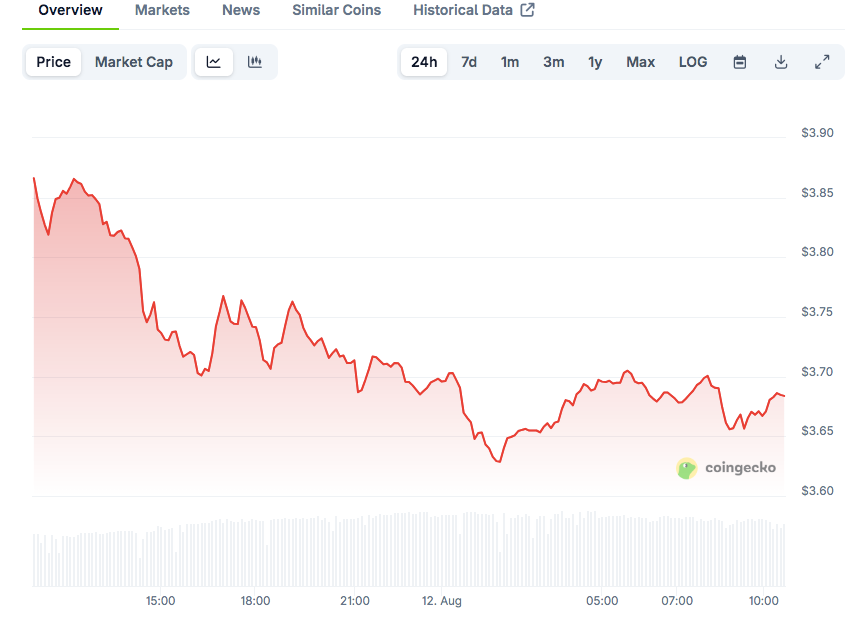
SUI is currently trading at $3.69, according to CoinGecko, with 24-hour volume above $1.26 billion.
While that reflects a 5.05% drop on the day, the token is still up 5.24% over the past week. This mix of short-term weakness and longer-term strength fits with the idea of a consolidation before a push higher.
The symmetrical triangle suggests energy is building. Once price escapes its tightening range, volatility is likely to spike. This could create fast moves toward the levels Clay outlined, though the path may include retests and pullbacks.
For traders, the setup offers a clear framework: watch the triangle’s resistance for a breakout and measure follow-through against the marked targets. With the higher timeframe still leaning bullish, the next decisive move could set the tone for SUI’s direction in the weeks ahead.
The post Sui Price Setup Points to Potential Breakout Targets Above $7 appeared first on Blockonomi.


