TL;DR:
Once again, Solana captures the attention of market traders after triggering a technical buy signal by trading above $78 this past June 30. The asset’s behavior in the coming days will determine if the momentum has enough strength to consolidate a structural recovery.
2/7 The SuperTrend indicator flipped bullish after Solana broke above $78 on June 30.
That puts the broader trend back on the buy side.
But technicals are only part of the story. On-chain activity also points to improving market conditions.https://t.co/iybH1VaMNT
— Ali Charts (@alicharts) July 10, 2026
The SuperTrend indicator shifted its status to green after the token broke through the $78 barrier at the end of June. Market analysts suggest that this shift puts short-term trend trackers on high alert for potential price variations.
The movement above $78 returned the price to a historical support range. According to chart evaluations in the technical report, this specific level served as a foundation for significant rallies in previous market cycles, accumulating an advance of over 260% on one occasion.
The appearance of an isolated buy signal does not represent a definitive confirmation of a macro shift. Traders’ readings indicate that the asset requires steady demand above support to keep its acceleration active.
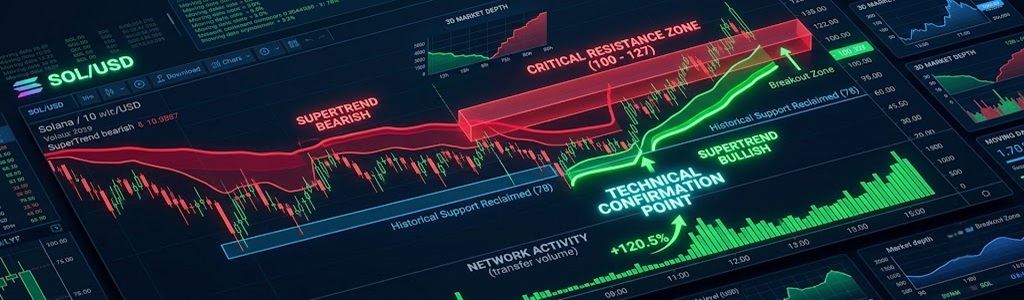
Now, the trading price is approaching its main technical congestion zone. A clean cross above the band extending from $100 to $127 could strengthen the buyers’ current structure.
If the price clears this margin, $127 would become the first relevant upside target. Market analysts’ interpretation points out that a daily close above this ceiling would offer clear validation for capital flows. Conversely, a rejection in this zone would slow down the recovery, causing a pullback toward the $78 base.
Activity within the blockchain also shows positive variations in its fundamental metrics. The Real-World Assets (RWA) sector integrated into the network totaled $3.03 billion at the close of the last evaluated period.
On-chain activity records reflect a 120.5% increase in transfer volume over a thirty-day span. Data platform analysts suggest that the expansion in ecosystem utilization adds fundamental backing to discussions regarding the asset’s valuation.
Long-term projections contained in the technical report propose scenarios toward $233.8, provided the structure retains its firmness. Such a move would require a revaluation of over 190% from current support levels. Extended evaluations mention the $456 mark, though analysts warn that this latter scenario depends on a favorable macroeconomic environment and does not constitute a confirmed short-term target.
The market will monitor the behavior of daily transaction volume over the upcoming weekly closes to assess the consistency of the reclaimed support.





