TL;DR
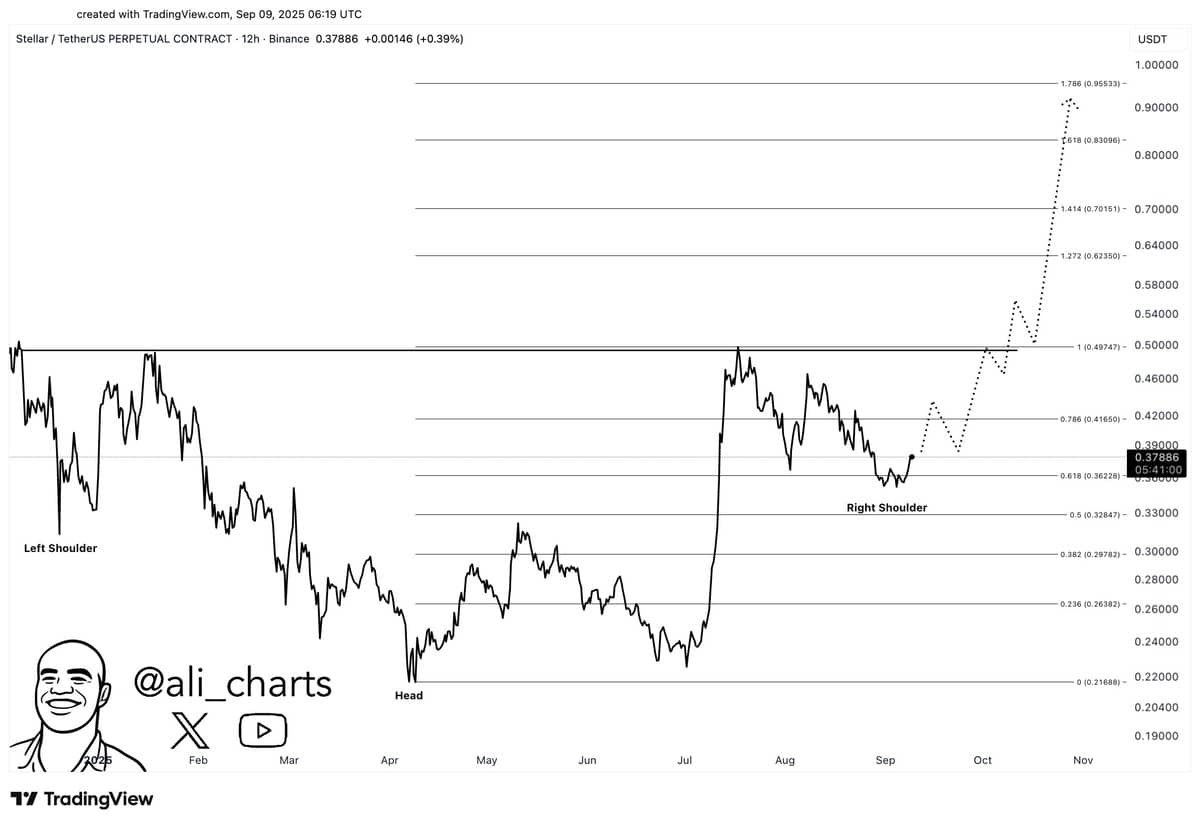
Stellar (XLM) is forming an inverse head and shoulders pattern on the 12-hour chart, according to analysis shared by crypto analyst Ali Martinez. The pattern includes a left shoulder in the January–February period, a lower low in April–May forming the head, and a right shoulder that began forming in August. The neckline sits near the $0.50 level.
Notably, XLM is trading around $0.38, above the 0.618 Fibonacci retracement level at $0.36. A confirmed breakout above $0.50 may lead to further gains, with Fibonacci extension levels marking potential resistance at $0.62, $0.70, $0.83, and $0.95. The structure’s final target appears just below the $1.00 mark. Support levels are noted at $0.36, $0.33, and $0.30 in the event the breakout fails.
He noted,
“Stellar $XLM forms the right shoulder of a head and shoulders pattern. Bullish breakout could target $1!”
The 4-hour chart shows a bullish shift, with the SuperTrend indicator turning positive for the first time since August 25. This move followed a breakout above the $0.372 resistance level, suggesting a change in short-term momentum.
A “Buy” signal appeared on the chart as the price moved above the SuperTrend band. If the asset holds above $0.37, a move toward $0.38–$0.39 is possible. A decline below $0.365 would weaken the setup.
Stellar $XLM flipped bullish for the first time since August 25, according to the SuperTrend indicator. pic.twitter.com/wTGIl3D6l5
— Ali (@ali_charts) September 9, 2025
XLM trades at around $0.38 at press time. The 24-hour trading volume is $264.46 million, with a 1% drop over the last day. Over the past week, the asset has increased by 4%, trading within a narrow range between $0.30 and $0.40.
The market remains in a consolidation phase, with no clear signs of either strong accumulation or distribution. Buyers and sellers appear evenly matched at current levels.
As of September 10, data shows that XLM recorded a net inflow of $874.71K to spot exchanges. This indicates more XLM was deposited than withdrawn, which can suggest near-term selling activity.
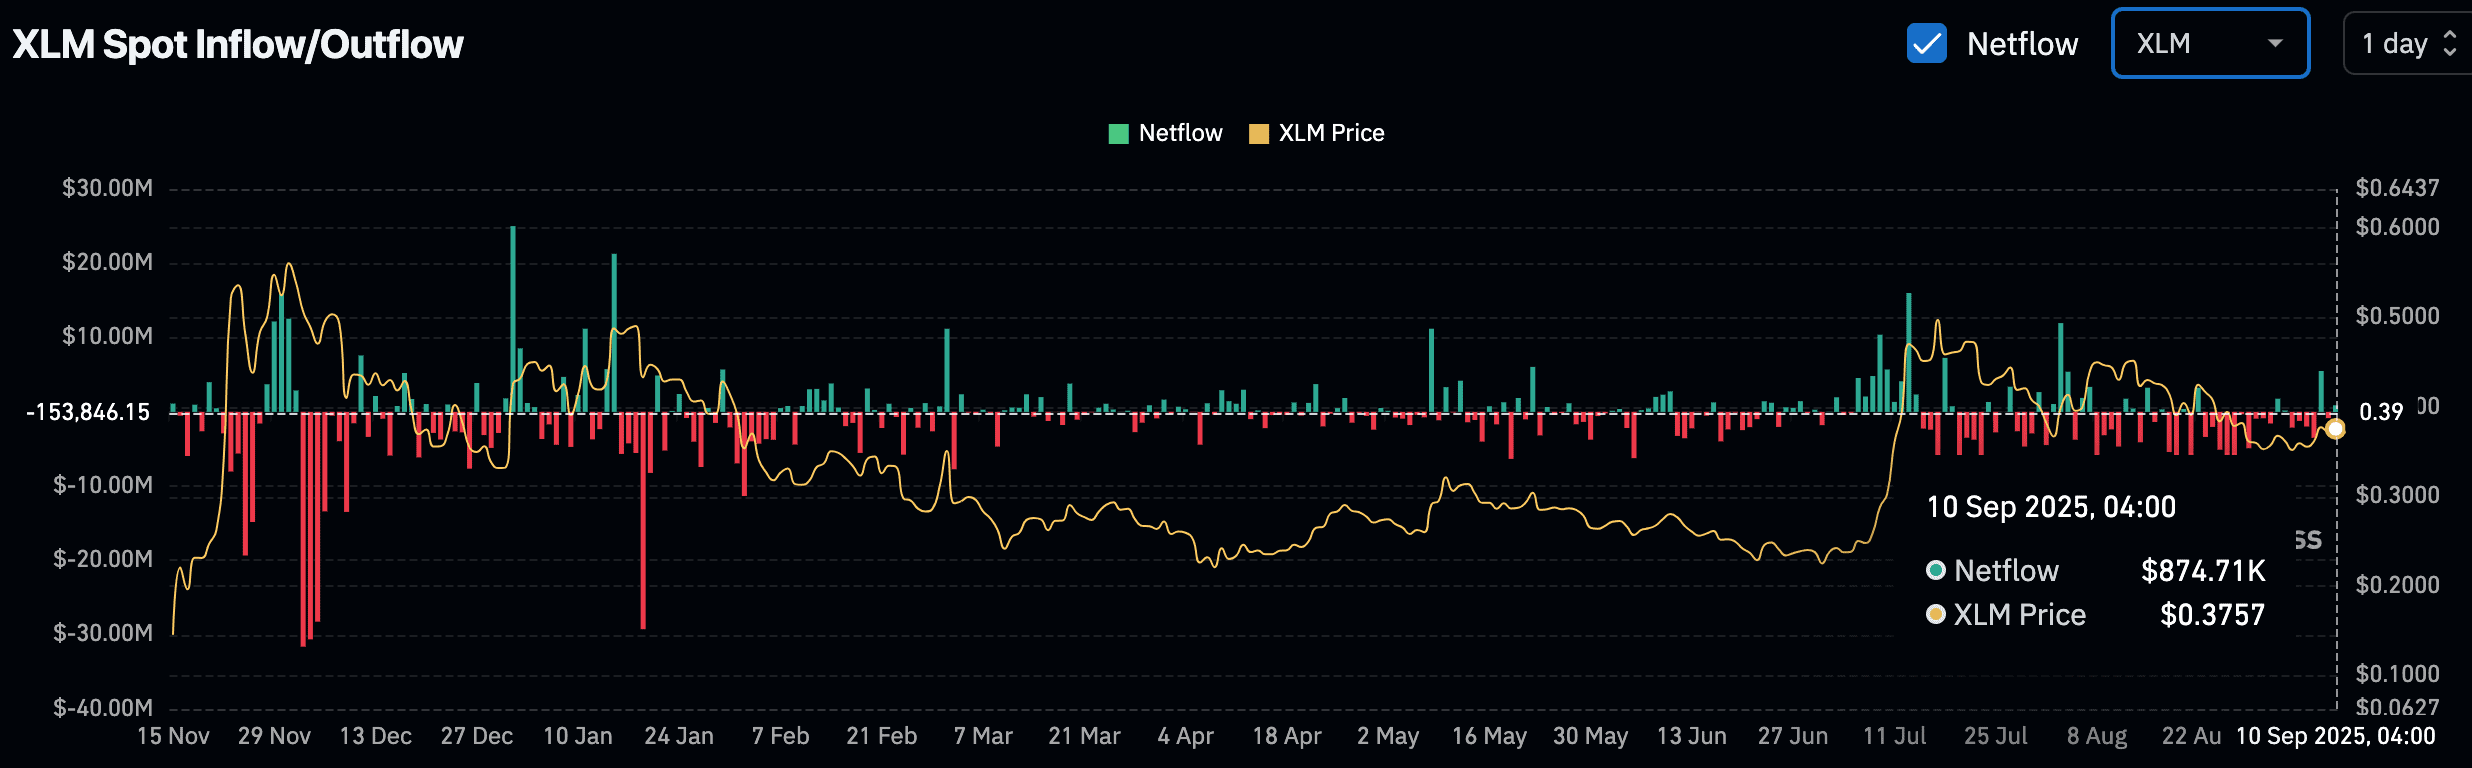
Although the inflow is positive, the size is small compared to earlier spikes on the chart, some of which exceeded $20 million. The movement likely reflects routine positioning rather than a major sentiment shift.
The post XLM Charts Signal $1 Move as Pattern Takes Shape appeared first on CryptoPotato.

