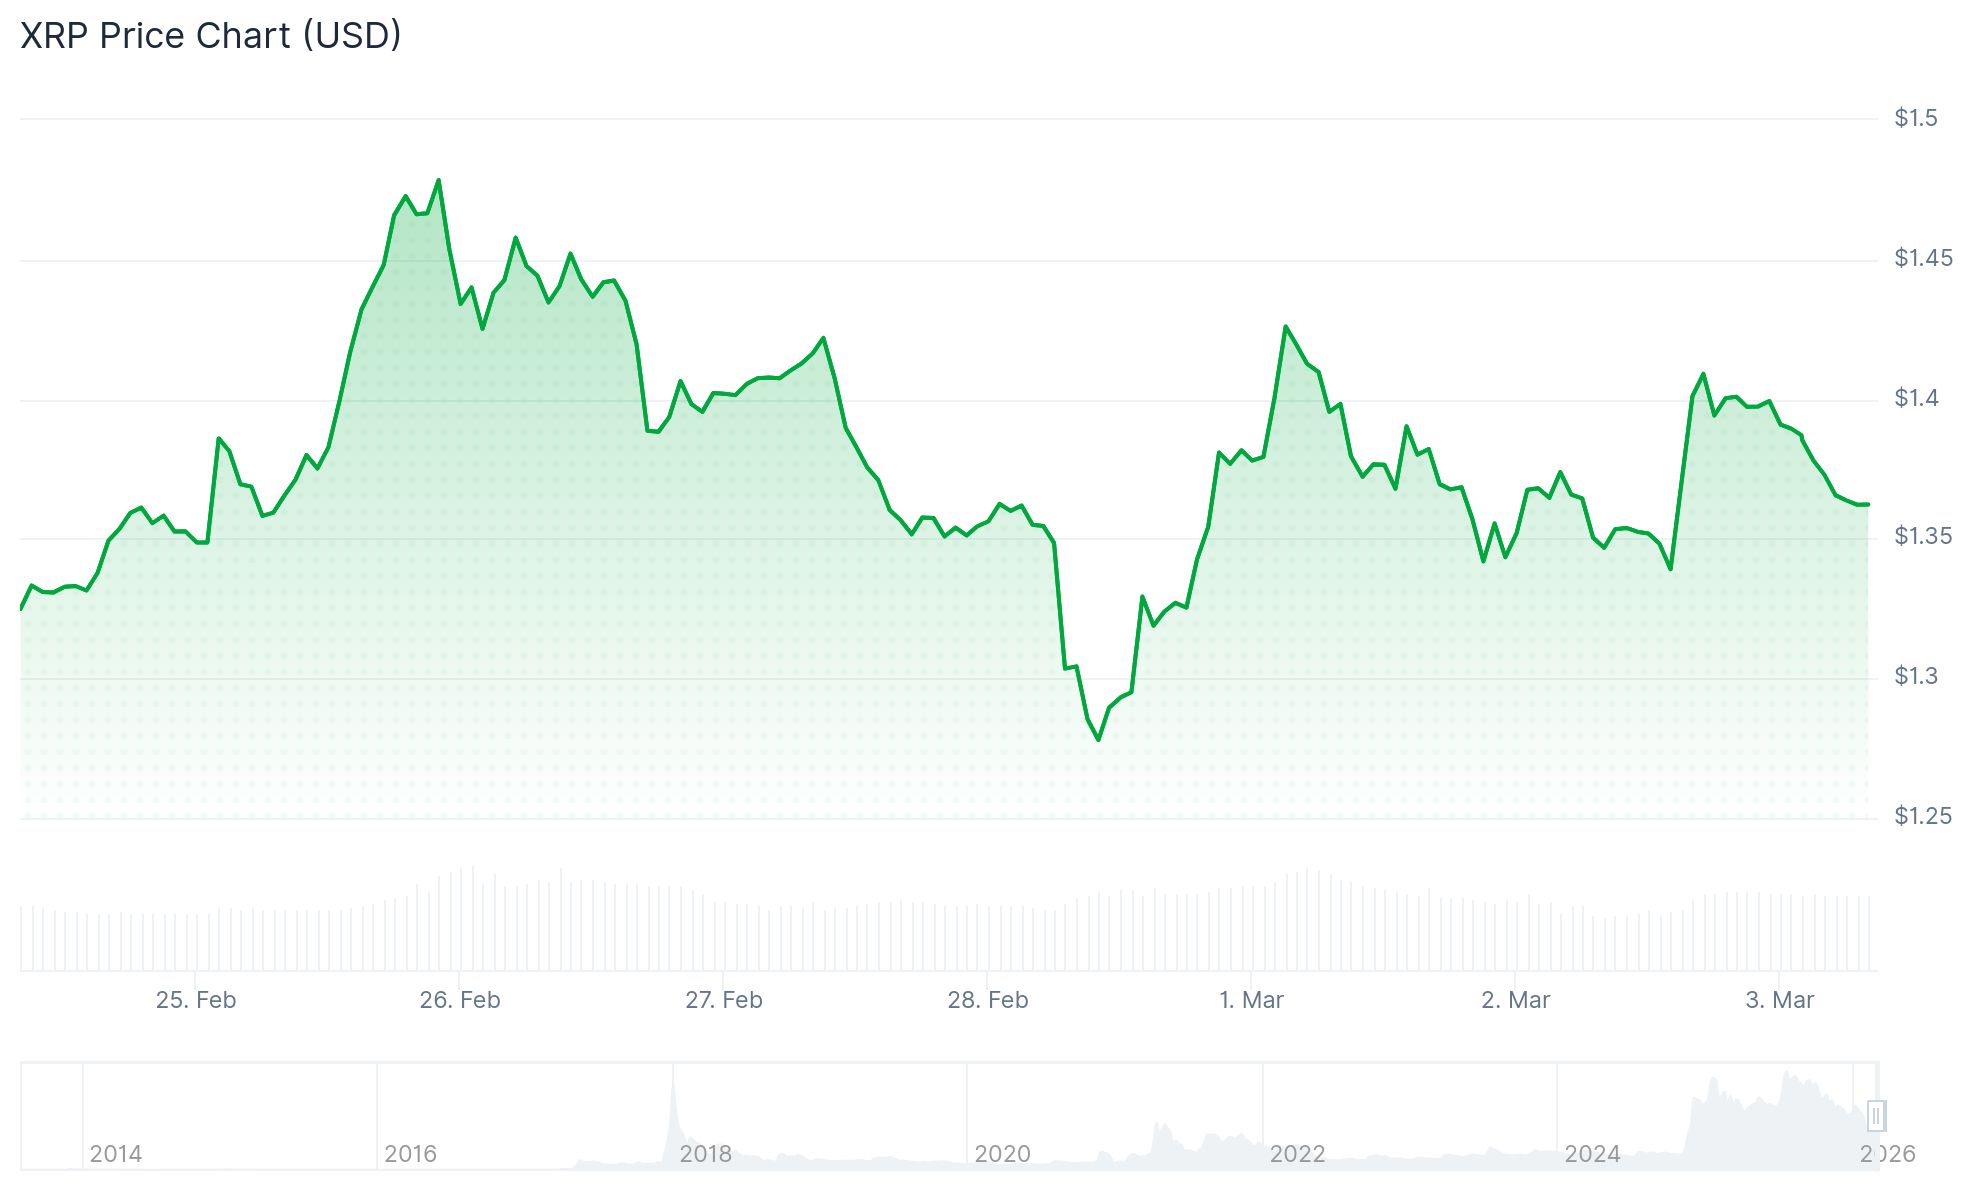
XRP dropped 1.90% on March 3 to trade around $1.36, pulled lower by a broader sell-off triggered by the Iran war and rising energy prices.
Oil markets reacted sharply. WTI crude jumped 6.3% to $71.23 and Brent rose 7% to $77.74. European gas prices surged 40–50% after reports of disrupted tanker flows through the Strait of Hormuz, a halt in Qatar’s LNG output, and a partial shutdown at Saudi Arabia’s Ras Tanura refinery.
Higher energy prices raise inflation expectations. That can push bond yields up and reduce the odds of rate cuts — conditions that tend to weigh on risk assets like XRP.
Federal Reserve presidents John C. Williams and Neel Kashkari were scheduled to speak on March 3. Their comments on energy-driven inflation were closely watched for signals on the rate outlook.
On March 2 (ET), U.S. spot Bitcoin ETFs recorded total net inflows of $458 million, with none of the 12 ETFs posting net outflows. Spot Ethereum ETFs saw total net inflows of $38.69 million, with none of the nine ETFs recording net outflows. XRP spot ETFs posted total net inflows… pic.twitter.com/Y3xrX7Sxi2
— Wu Blockchain (@WuBlockchain) March 3, 2026
Despite the price dip, US-listed spot XRP ETFs saw their largest single-day net inflow in about a month. SoSoValue data showed $6.97 million flowing in, lifting total net assets to roughly $1.02 billion. Some investors appeared to use the dip to add exposure through regulated products.
XRP is trading in a weak broader market. CryptoQuant data shows roughly 38.8% of altcoins are now trading near all-time lows. That reading is worse than the period right after the FTX collapse in late 2022, when the figure stood near 37.8%.
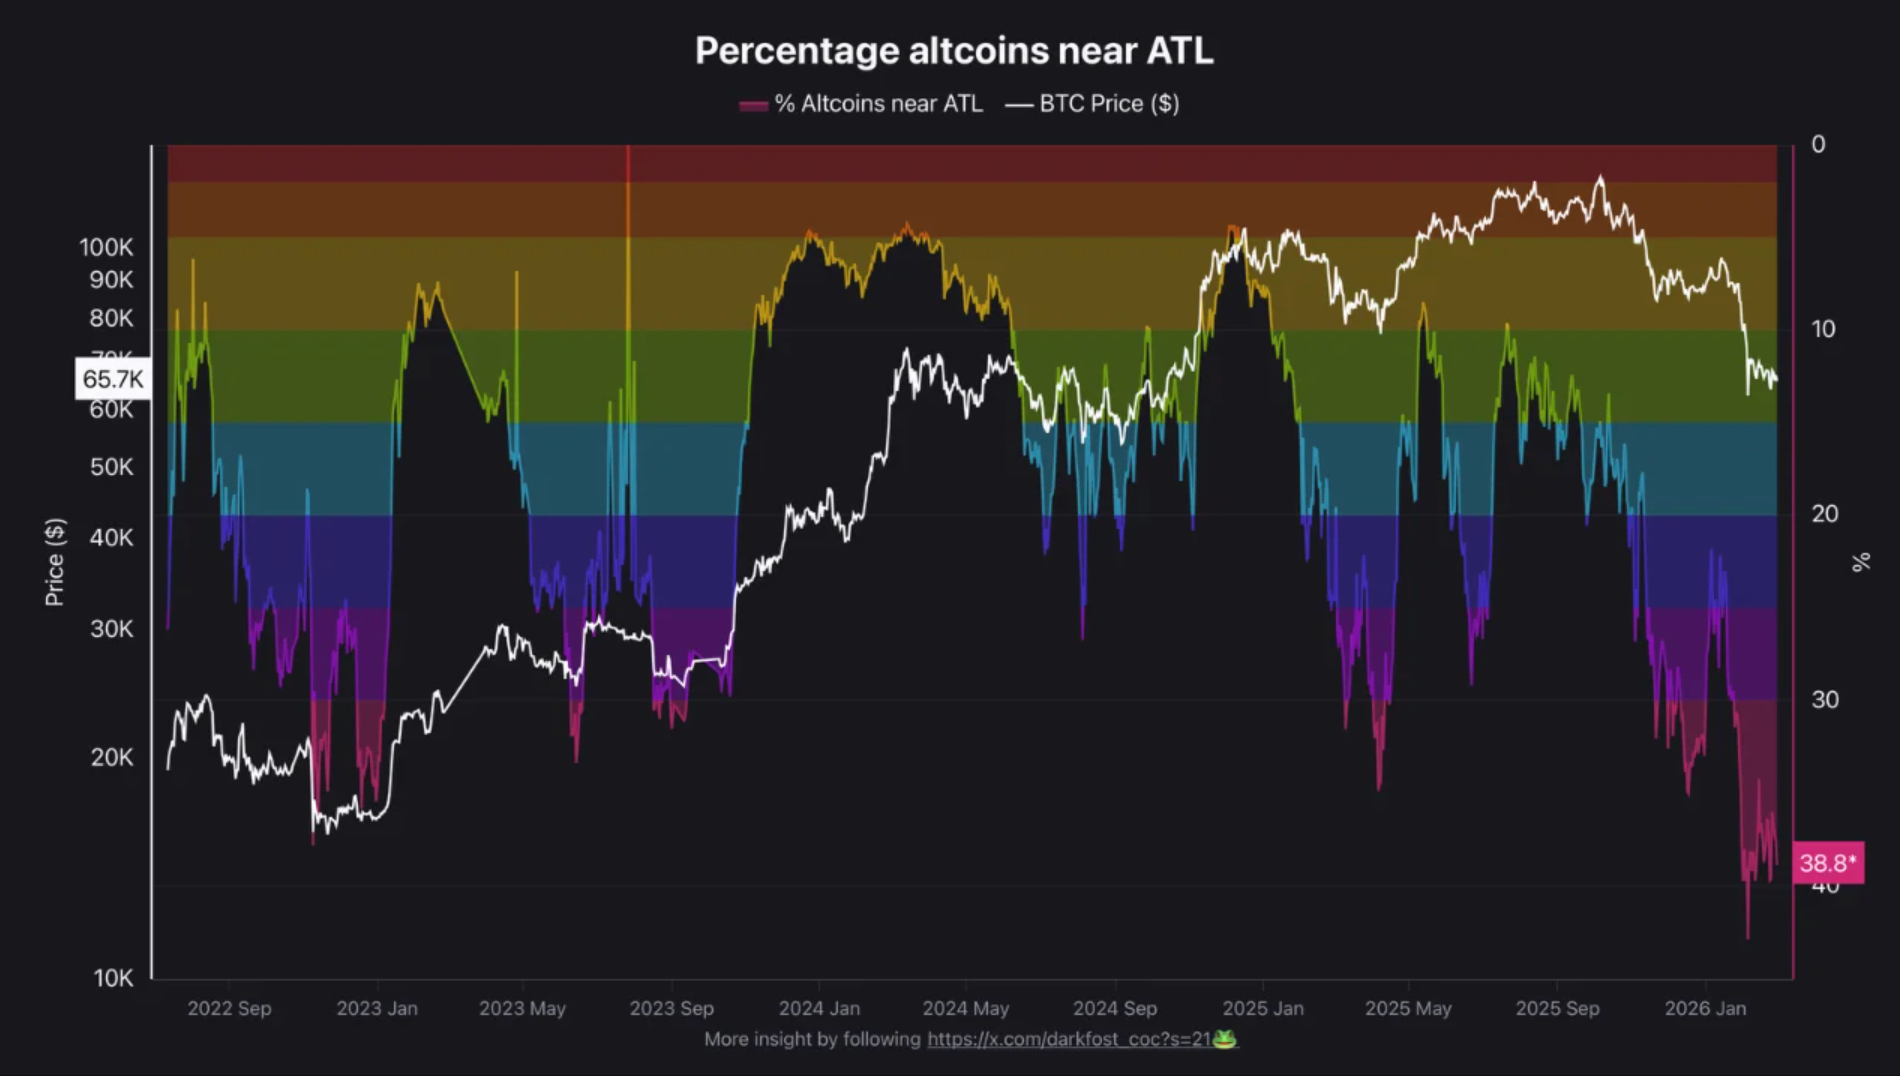
When a large share of altcoins are near lows, capital tends to move toward Bitcoin or other perceived safer assets. That backdrop can limit how far XRP bounces, even when buyers step in.
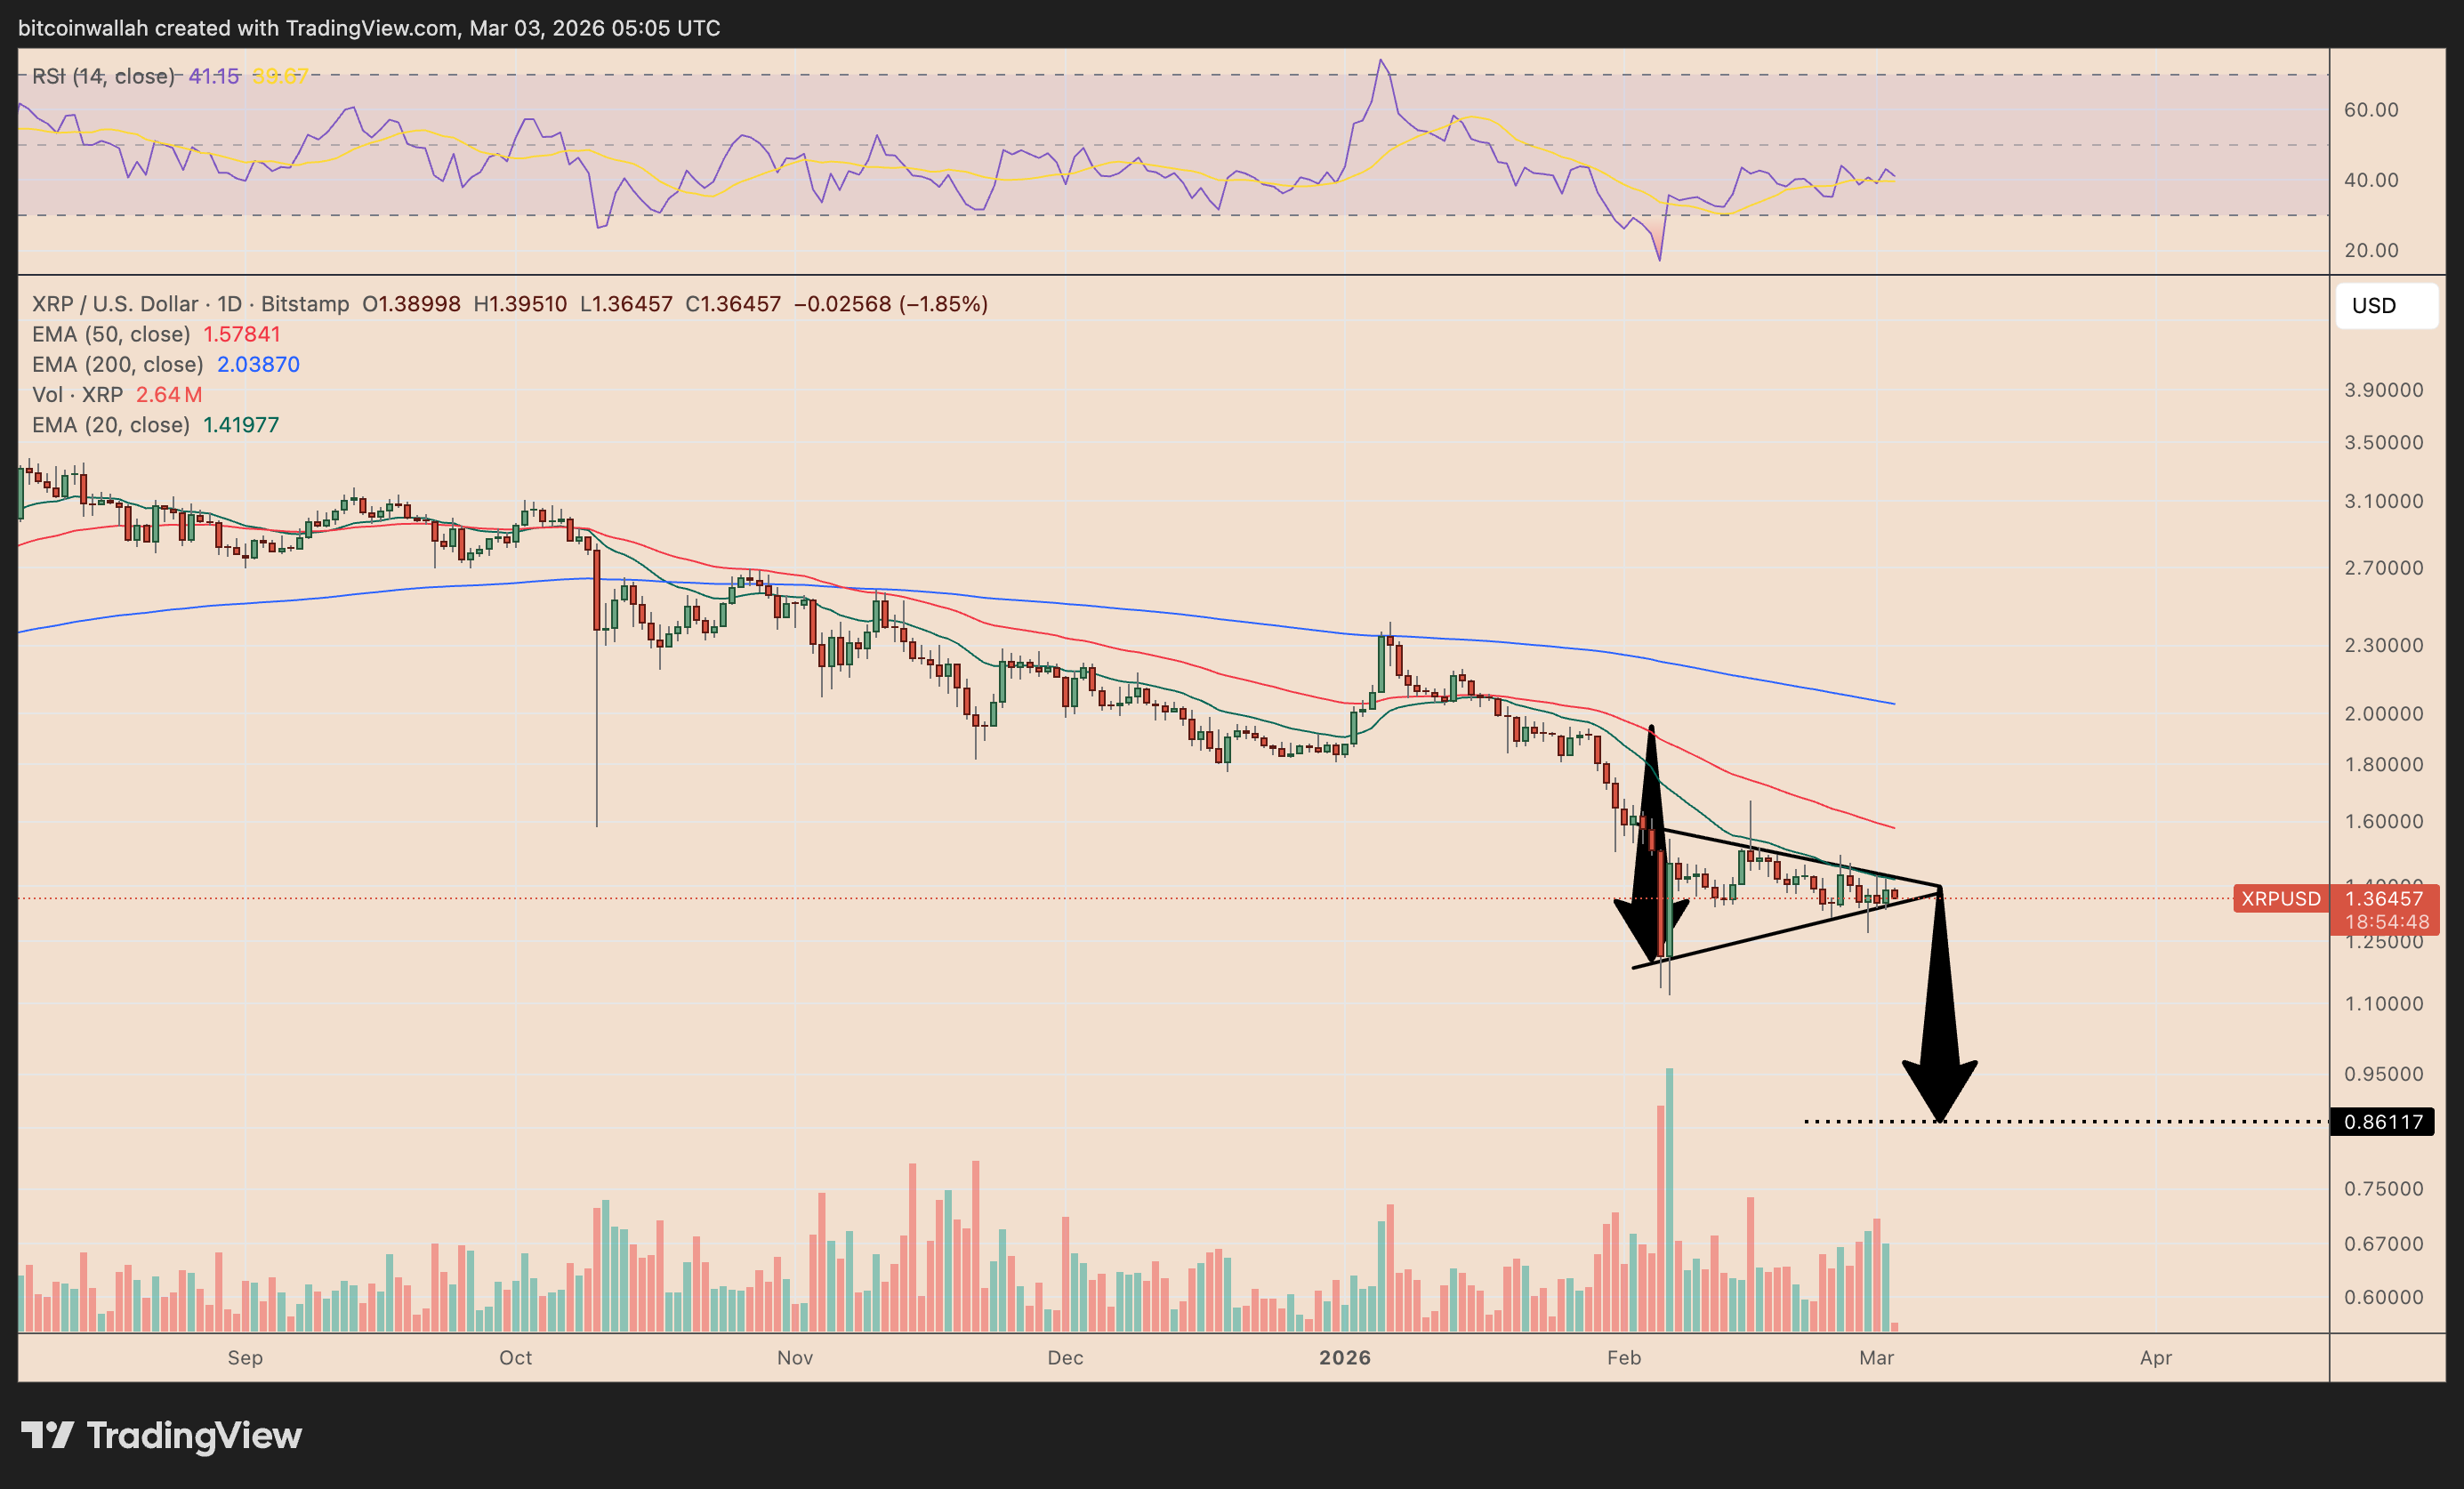
From a technical standpoint, XRP has been consolidating after falling from around $2.40 earlier this year. It remains below its 50-day simple moving average near $1.62. The RSI sits near 40, reflecting weak momentum without being oversold.
#XRP – Fractals Give Clues, Not Certainty
:
Let me clarify my position on fractals:
Fractals are not prediction tools.
— EGRAG CRYPTO (@egragcrypto) March 2, 2026
Key support sits between $1.30 and $1.32, with a stronger demand zone near $1.20. Resistance is at $1.45, then the 50-day SMA at $1.62. A bear pennant pattern on the daily chart, if confirmed by a break below support, points to a measured move target near $0.86.
On the institutional side, Hidden Road officially went live on the NSCC directory on March 2, 2026, per a DTCC notice. The NSCC handles post-trade clearing and settlement for US equities.
The integration of #Ripple and Hidden Road continues to scale.
The latest DTCC notice shows Hidden Road ($HRFI) officially going live on the NSCC directory March 2, 2026. Ripple Prime's role in bridging TradFi and DeFi will likely move post-trade volume to the XRPL pic.twitter.com/H9qwav3fLO
— 𝗕𝗮𝗻𝗸XRP (@BankXRP) March 2, 2026
Hidden Road’s listing strengthens Ripple Prime’s role in connecting traditional finance with blockchain infrastructure.
While the move doesn’t directly create XRP demand, market participants often treat institutional connectivity as a long-term positive signal for XRPL adoption.
JPMorgan also noted that a US crypto market structure bill could pass by mid-year, which the bank views as a potential positive for digital assets.
The post Ripple (XRP) Price: Iran War Sends XRP to $1.36 — Is a 35% Drop Next? appeared first on CoinCentral.

