XRP pulled back after touching $1.5074, and traders are now watching a cluster of support levels to see if the price can set up another move higher.
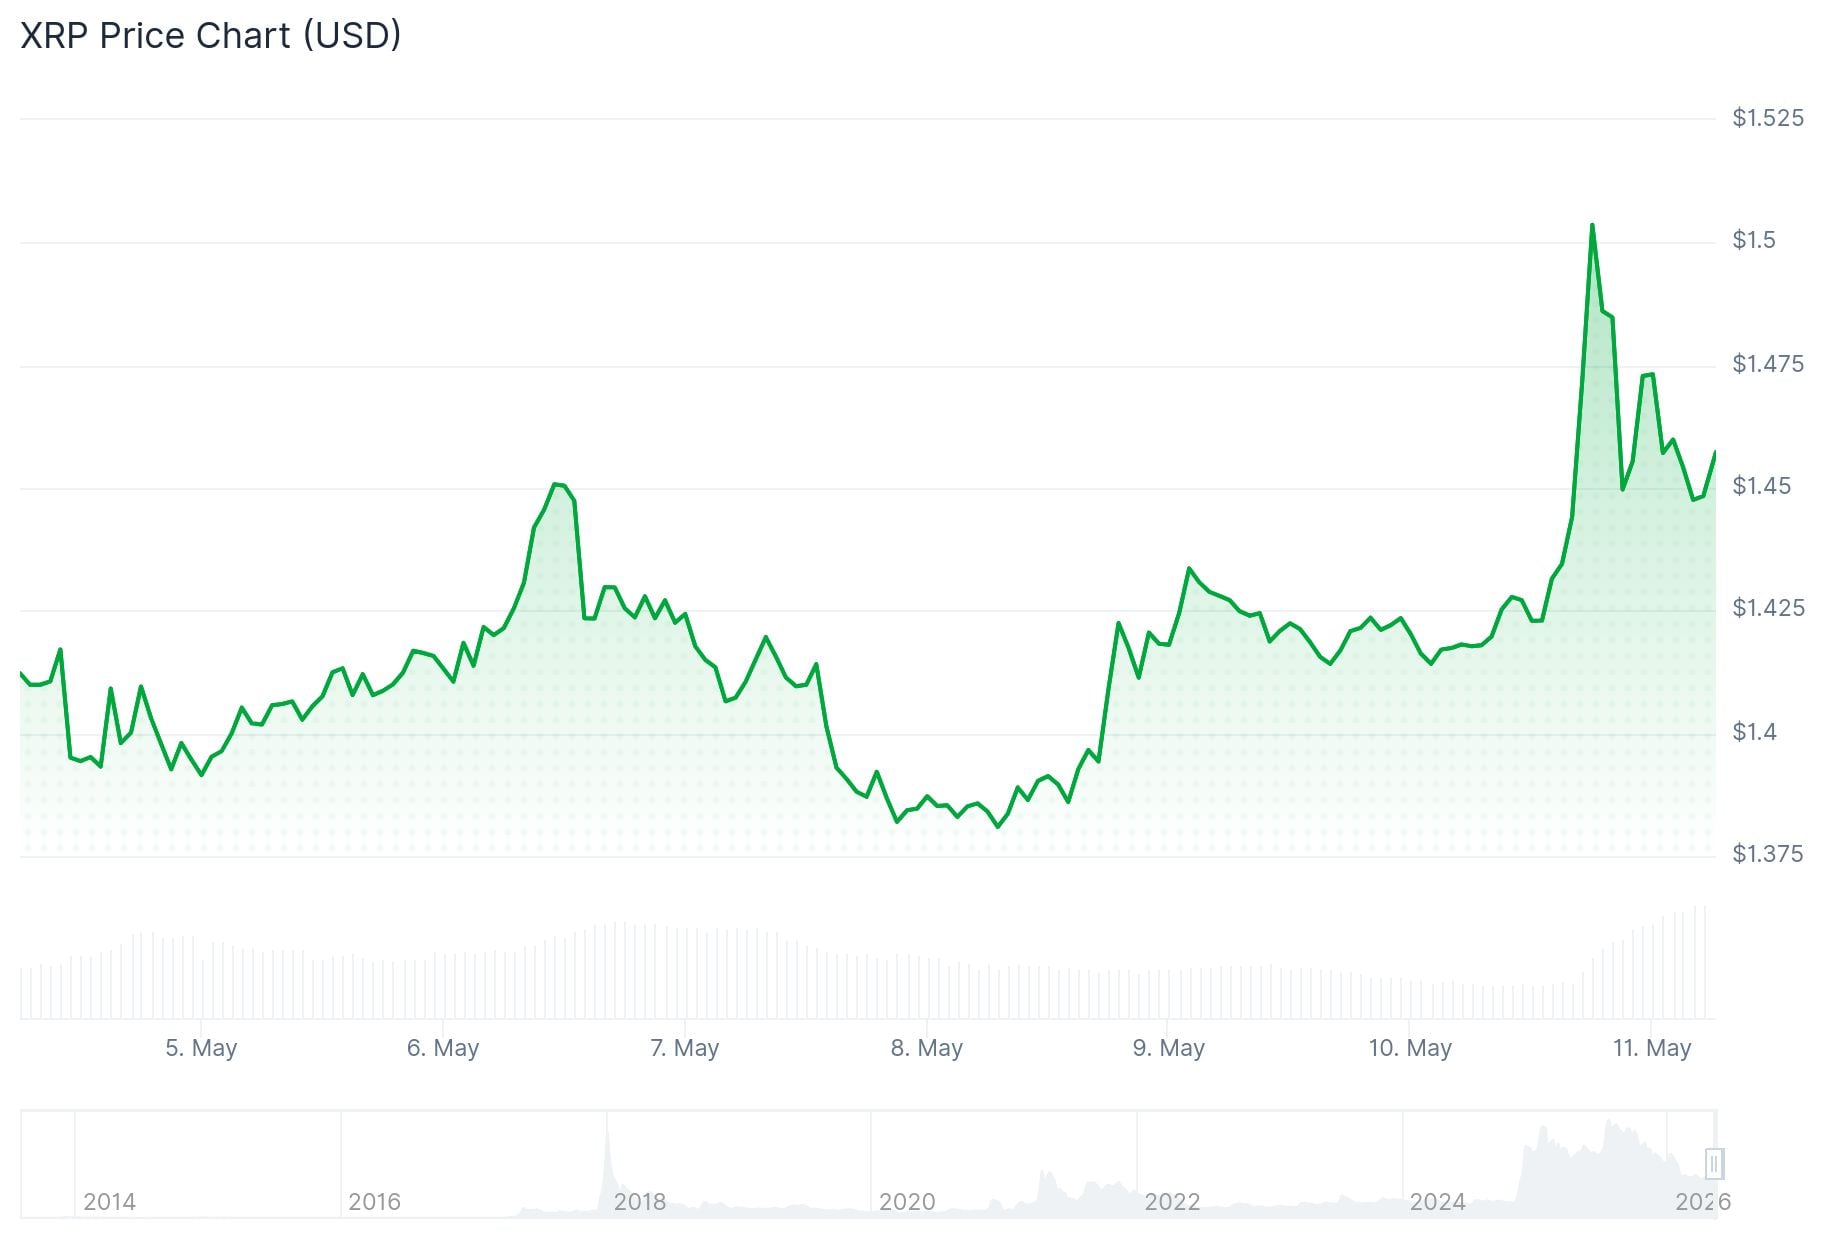
The token outperformed Bitcoin and Ethereum on the way up, climbing past $1.45 before losing steam near $1.5050. After the high, the price dropped below $1.48 and $1.4620, slipping under the 38.2% Fibonacci retracement of the $1.3786 to $1.5074 range.
At the time of writing, XRP is trading around $1.42 to $1.44, sitting above the 100-hourly Simple Moving Average. A bullish trend line is forming on the hourly chart with support at $1.4420.
For a fresh push higher, bulls need to clear $1.4620. A break above that level opens the door to $1.4770, then $1.5050. Further targets sit at $1.520 and $1.550.
On the downside, a failure to hold $1.4420 puts $1.4280 in focus, which lines up with the 61.8% Fibonacci level. A close below that could send the price toward $1.4120 and $1.40.
Analyst Darkfost posted on X that XRP’s funding rates on Binance have held a bearish bias for close to three months — the longest such stretch recently. This is happening even as XRP is up about 27% over that same period.
During this correction, driven by an uncertain global backdrop, the altcoin sector was the first to suffer the consequences.
As a result, the Total3 index, which represents the crypto market cap excluding $BTC, $ETH, and stablecoins, lost more than $544B.
However, the… pic.twitter.com/JZToj19FmI
— Darkfost (@Darkfost_Coc) May 9, 2026
Darkfost pointed to April 2025 as a comparison. At that time, XRP was at $1.25 with similarly bearish positioning, and the price went on to rally 126%.
“When such a strong consensus forms, especially after a correction exceeding 60%, it is often a sign that a potential reversal may be developing,” Darkfost wrote.
Separately, analyst CW noted on X that a golden cross of sub-indicators is forming, and called a full-scale rise “imminent.”
A full-scale rise for $XRP is imminent.
Preparation for launch has been completed at the bottom line. A golden cross of the sub-indicators is imminent. https://t.co/LuGMVcgBdf pic.twitter.com/CUNfqmcV1L
— CW (@CW8900) May 10, 2026
Analyst Egrag Crypto has drawn attention to XRP’s weekly chart. He noted that XRP’s historical cycle lows have shown decreasing deviation below the 200-week SMA each cycle — roughly 60% below in the first cycle, 40% in the second.
#XRP – Bottoming Thesis Below 200 SMA :
This Weekly #XRP chart presents a VERY interesting diminishing downside structure relative to the 200 SMA.
Let’s break it down carefully:
First major cycle low:
#XRP bottomed roughly: ~60% below the 200 SMA
— EGRAG CRYPTO (@egragcrypto) May 10, 2026
If the pattern holds, the next potential bottom would sit around 20% below the 200-week SMA, pointing to approximately $0.93. Egrag called it a “logical structure,” not a confirmed bottom.
XRP is still holding its long-term ascending trendline on the weekly chart.
Derivatives data from CoinGlass shows futures volume fell 34% to $2.05 billion, while open interest rose 1.05% to $2.72 billion. The OI-weighted funding rate was 0.0052%, a slightly positive reading.
XRP’s 24-hour trading volume stood at $1.2 billion with a 30.48% decline, per CoinMarketCap.
The post XRP Price: Traders Have Been Shorting for 3 Months — Here’s Why That Could Backfire appeared first on CoinCentral.

