XRP is holding just above $1.09 on Bitstamp, but the broader trend has been pointing lower for weeks. The altcoin is down 2.23% in the past 24 hours, 4.24% over the past week, and 6.83% over the past month.
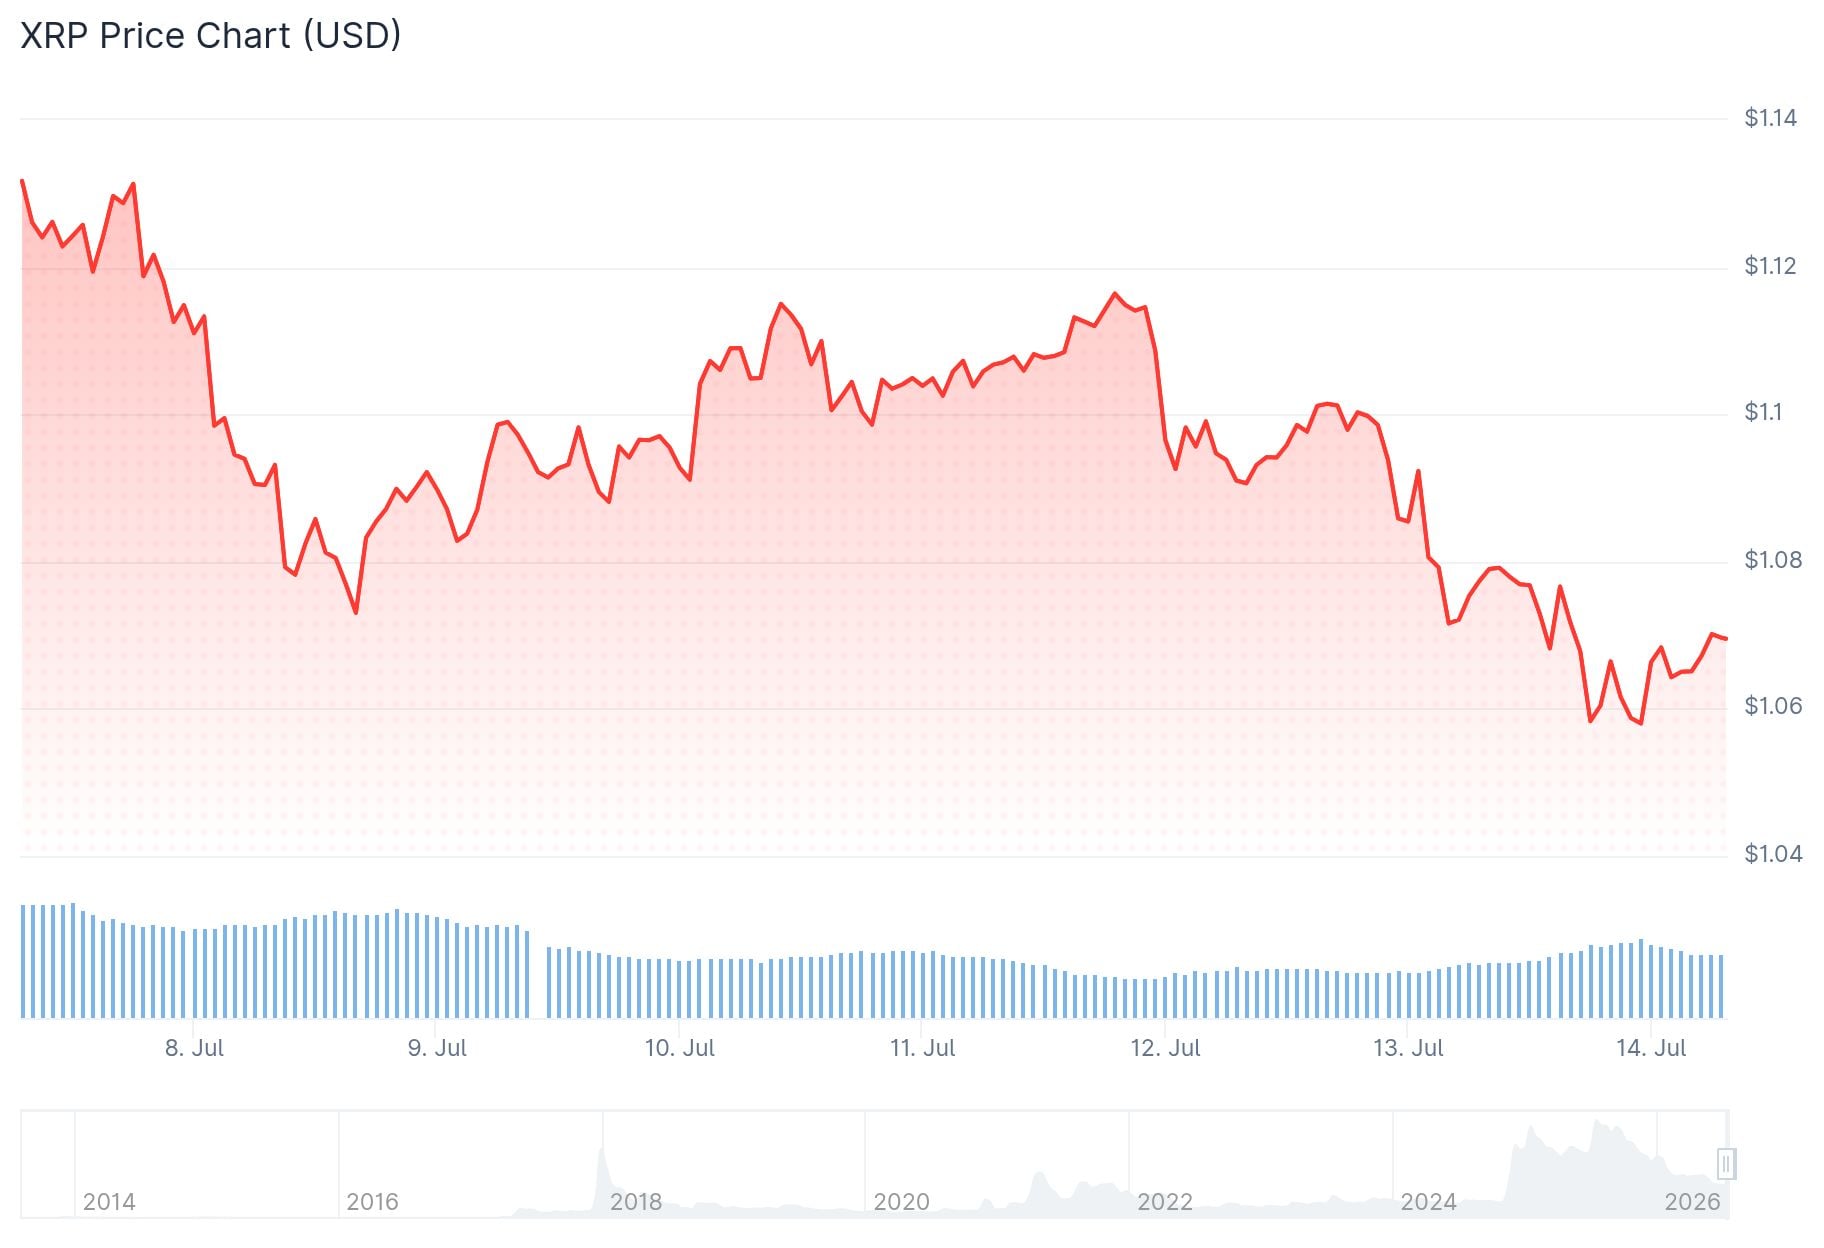
The price decline stretches back to August 2025, when XRP set a swing high of $3.66. Since then, the trend has been consistently downward.
Trader attention is now locked on the $1.00 support level. This zone was a major breakout point roughly two years ago, making it historically meaningful for many market participants.
On the four-hour chart, XRP is also approaching support near $0.95. Analysts have noted what looks like an ending diagonal pattern forming — a setup that can signal trend exhaustion.
Market analyst @ew-forecast noted the pattern “could signal that selling pressure is starting to mature,” but added that the broader market structure remains bearish without a confirmed reversal.
On-chain data is raising eyebrows. According to Santiment data shared by analyst Ali Martinez, daily XRP Ledger transactions worth more than $1 million dropped from around 70 earlier in the week to just 2.
Whale activity on the $XRP Ledger has cooled significantly.
The number of transactions worth more than $1 million has dropped from 70 over the past week to just 2 today. pic.twitter.com/th3C7vEkT2
— Ali Charts (@alicharts) July 12, 2026
This doesn’t automatically mean large holders are selling. It points more to inactivity — large investors appear to be sitting on the sidelines waiting for clearer signals before making moves.
Open Interest has also been falling, which reflects a reluctance among derivatives traders to place directional bets. Exchange reserves are trending lower too, which can hint at accumulation, though not necessarily a quick price recovery.
Analyst Celal Kucuker posted on X, highlighting an RSI divergence on XRP. He stated simply: “A strong rally could be about to begin.” The divergence is worth watching, though it hasn’t translated into buying pressure yet.
$XRP is showing an RSI divergence.
A strong rally could be about to begin.
Hear it here first. pic.twitter.com/yMRgncE5qx
— Celal Kucuker (@CelalKucuker) July 13, 2026
TradingView’s composite rating for XRP sits at Neutral, but the breakdown shows 14 sell signals, 10 neutral, and just 2 buy signals. The RSI stands at 43.45, below the neutral 50 mark. The ADX reads 14.74, suggesting the current trend lacks strong directional force.
Most exponential and simple moving averages — from the 10-period to the 200-period EMA — are positioned above current price, all generating sell signals. The EMA 200 sits at $1.468, well above where XRP is trading now.
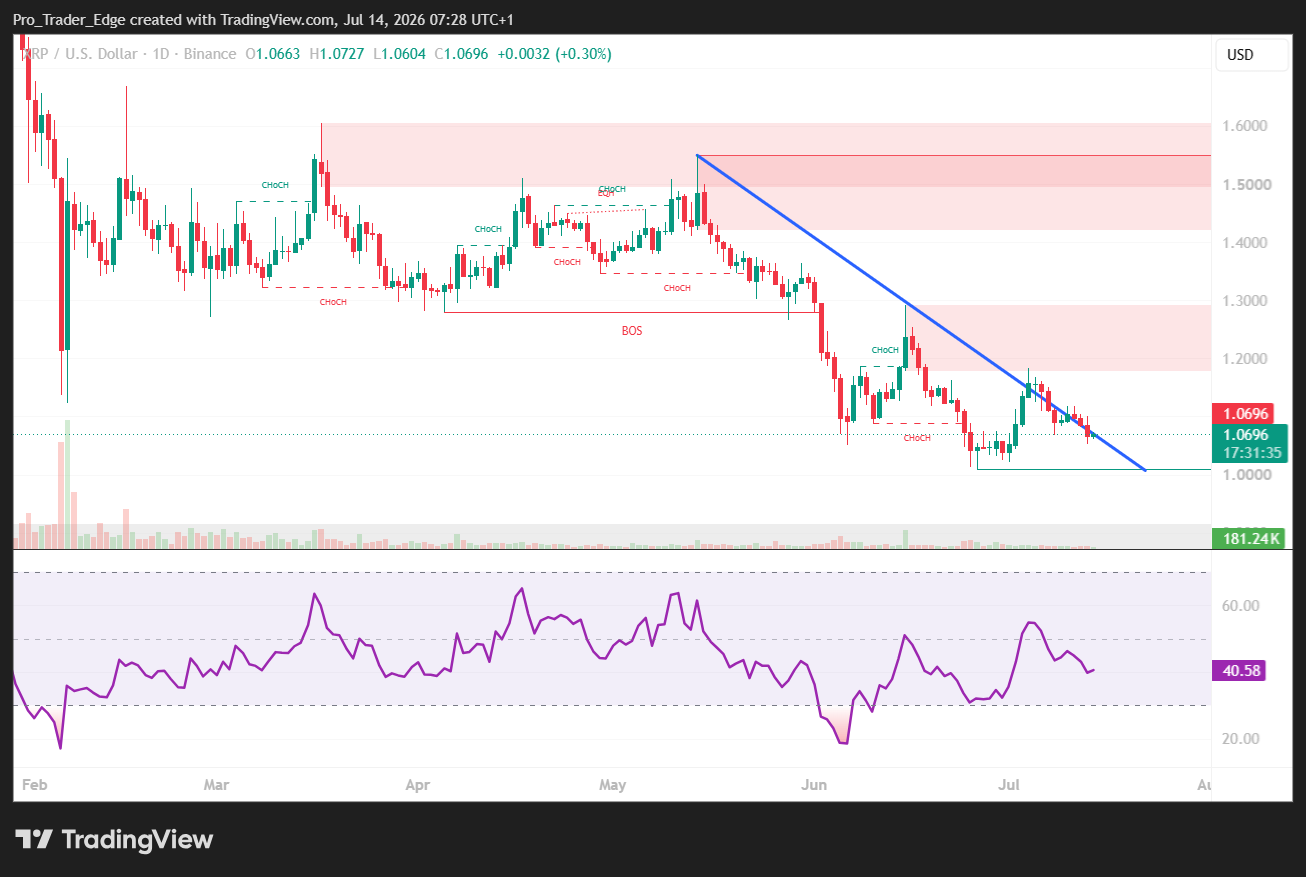
Key support levels are $1.00, $0.95, $0.85, and $0.60. If price breaks below $0.90, the next meaningful floor could be as low as $0.44, based on historical drawdown averages from previous cycles noted by analyst Chart Nerd.
Resistance sits between $1.10 and $1.13, where several moving averages converge.
The most recent data shows whale activity near historic lows for this period, with just 2 large transactions recorded on the XRP Ledger in the latest session.
The post Ripple (XRP) Price: Bullish Divergence Spotted as XRP Teeters Above Support appeared first on CoinCentral.





