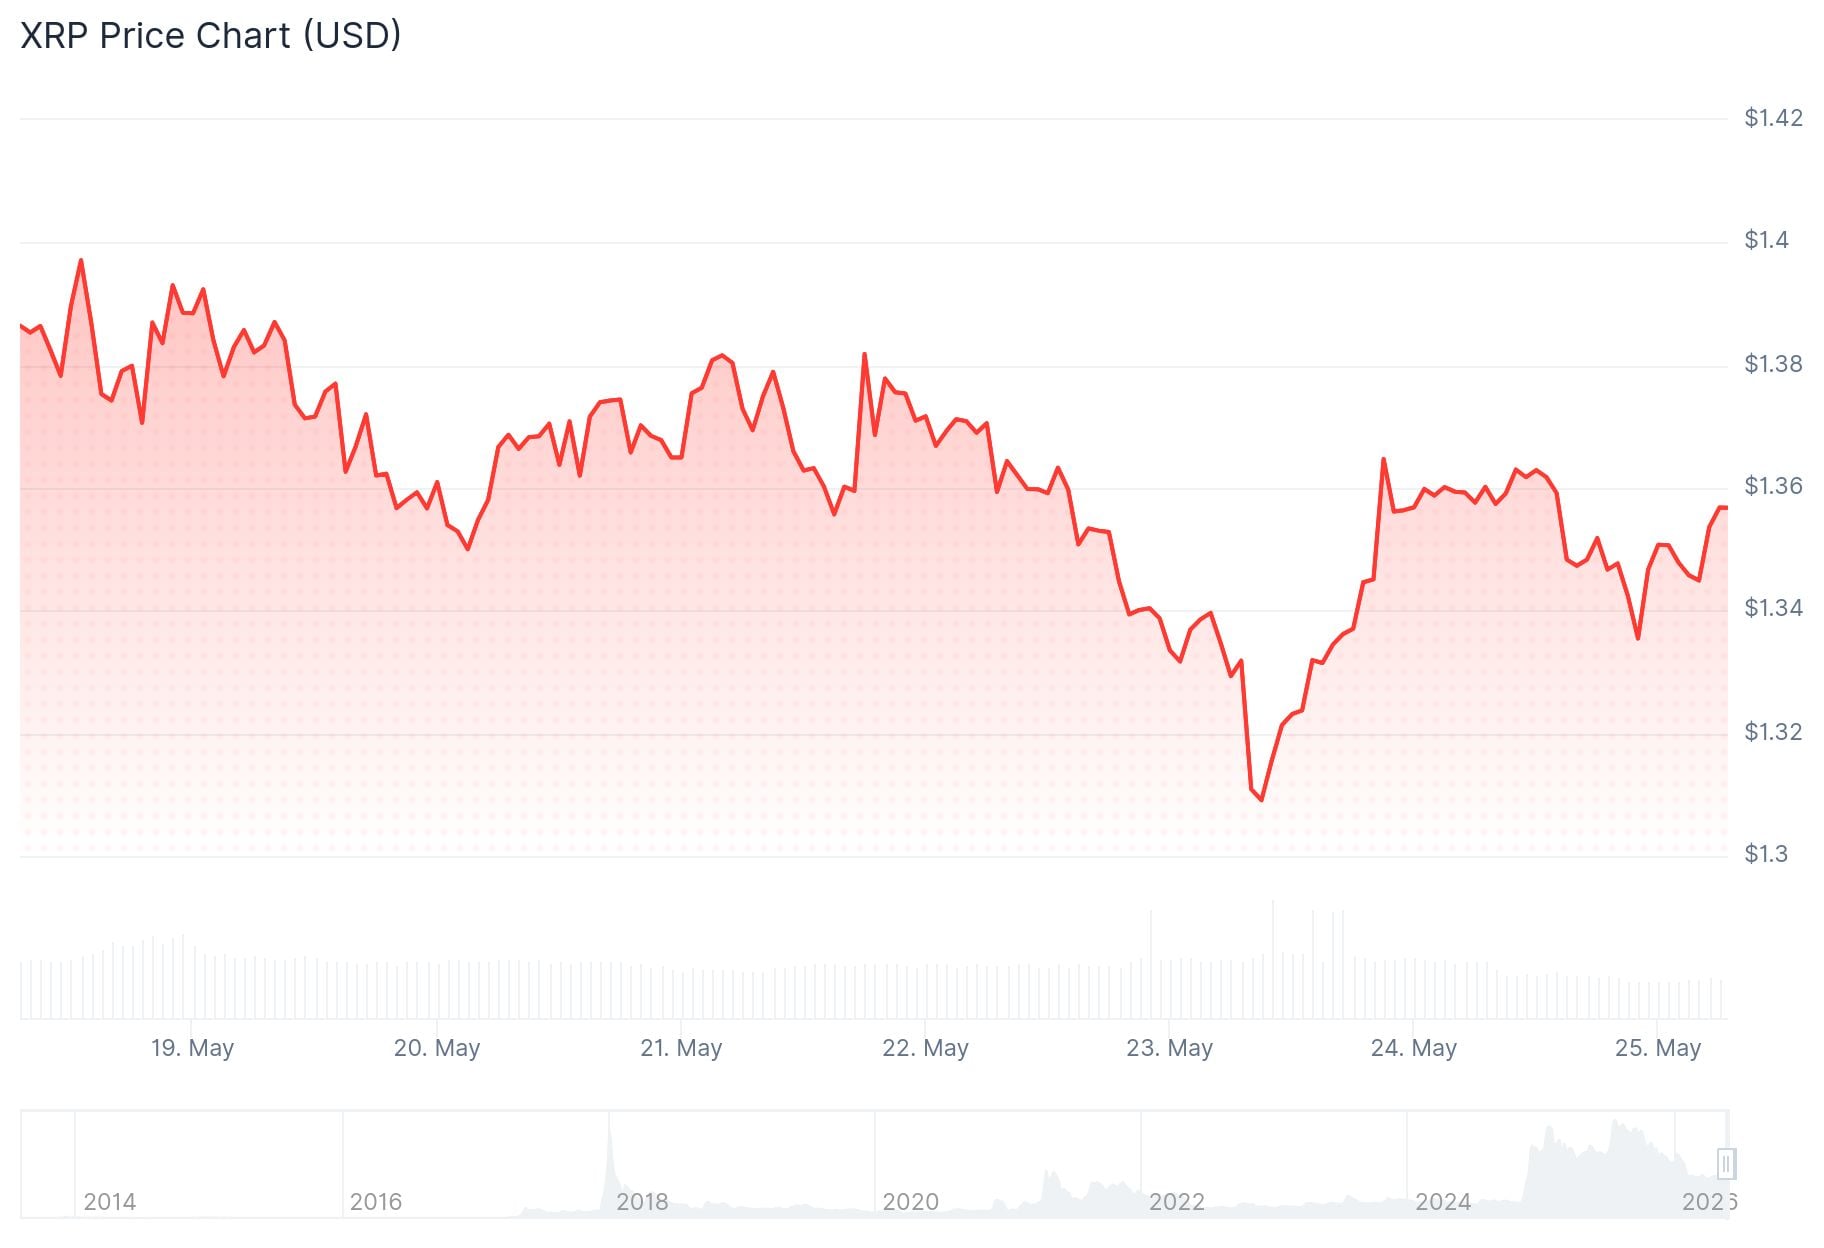
XRP is trading around $1.36 at time of writing, posting a 3.49% gain over the past 24 hours. Daily trading volume sits near $1.94 billion, and its market cap stands at roughly $84.18 billion.
Crypto analyst ChartNerdTA posted on X noting that $XRP has always swept its lower regression band on the 2-week timeframe during bear markets. He pointed out that the lower regression band for 2026 currently sits at $1.00, and that a bearish trend flip is still absent — similar to previous market cycles. His question: why should this time be different?
$XRP has ALWAYS swept its lower regression band on the 2-week timeframe during bear markets. The current lower regression band price tag in 2026 currently sits at $1, with a bearish trend flip still missing like in other cyclical structures. Why should this time be different? pic.twitter.com/6052ilM2vx
—
ChartNerd
(@ChartNerdTA) May 24, 2026
Analyst EGRAG CRYPTO has been tracking XRP’s structure since April 1 and says the core thesis hasn’t changed. His view is that daily price moves create noise, but market structure tells the real story.
He describes XRP as currently trading inside a descending broadening wedge. This is a pattern often seen before major volatility events, sometimes acting as a final shakeout before a larger move.
EGRAG identified $1.11 as the most critical support level within the current structure. A break below that zone could open the door to a much deeper retracement.
#XRP – Green
or Red
?
Choose your side… and state your reasoning.
Since the 1st of April, I have NOT changed my Green or Red trajectory thesis , only tracking how structure develops over time.
The noise changes daily… The structure does not.
Key levels… pic.twitter.com/3CTu8dAKgm
— EGRAG CRYPTO (@egragcrypto) May 24, 2026
On the upside, the $2.65 to $3.00 range is the area to watch. A weekly or monthly close above $3.00 would change the current market outlook entirely, according to the analyst.
Market account BankXRP described a recent sharp drop into the $1.3080 zone as a liquidity flush. The account said the move appeared to clear weaker holders out of positions as panic selling increased.
Another commentator, CW, said a further drop toward $1.30 remains possible if selling pressure continues.
Open interest edged up 0.49% to $2.85 billion, while trading volume fell 33.17% to $2.37 billion. The drop in volume alongside rising open interest suggests traders are holding positions but not adding aggressively.
The OI-weighted funding rate sits at 0.0032%, which points to a neutral derivatives environment. There is no strong lean toward either bulls or bears in the current data.
EGRAG also outlined a sequence of possible events ahead: more sideways trading, emotional exhaustion among traders, a volatility spike, and then a major directional move.
Some longer-term projections put XRP between $7 and $11 if the wedge breaks to the upside, though those targets depend on improved market conditions.
XRP continues trading inside the wedge structure, with traders watching whether $1.11 support holds through the current period of market pressure.
The post XRP Price: The Quiet Before the Storm — What the Charts are Showing appeared first on CoinCentral.





