XRP price action has captured trader attention as the cryptocurrency attempts to recover from recent lows while facing resistance at key technical levels. The digital asset recently found support near $2.68 and initiated a recovery wave that pushed prices above $2.80 and $2.85 resistance zones.
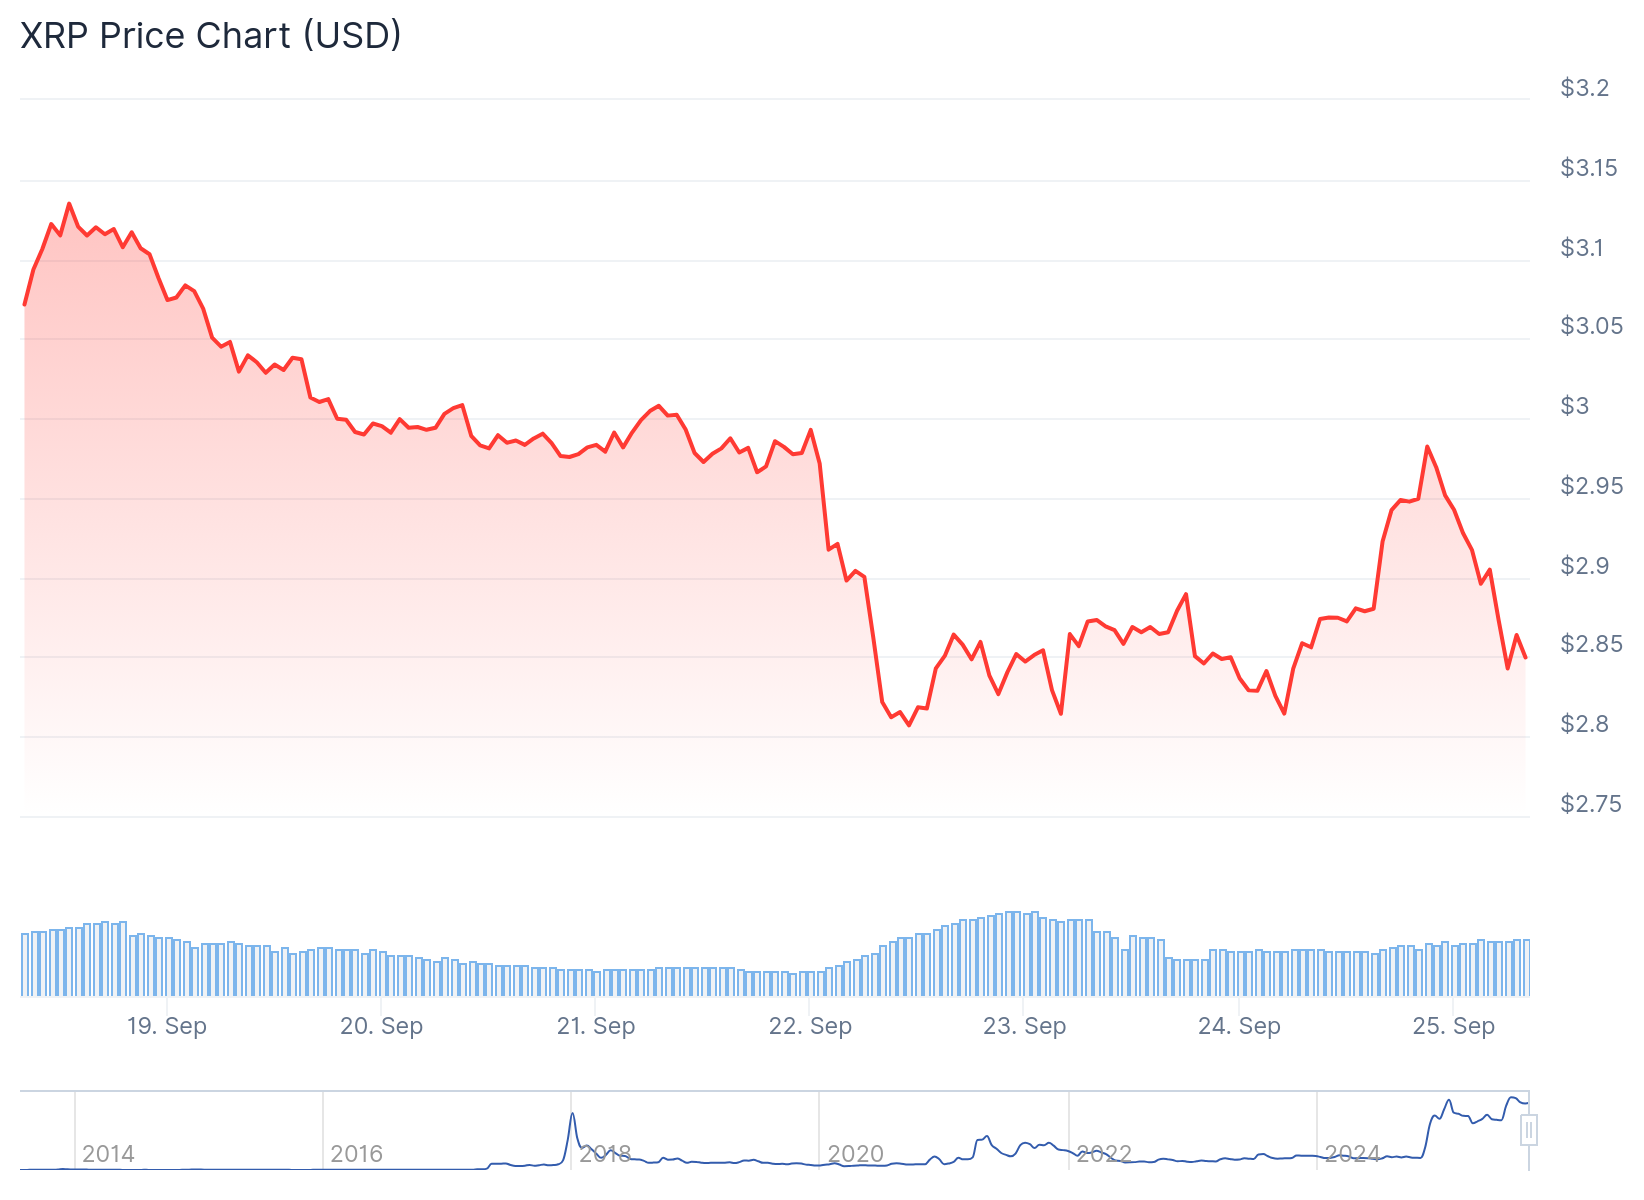
The recovery allowed XRP to surpass the 50% Fibonacci retracement level of its main decline from the $3.138 swing high to the $2.678 low. However, bears have shown strength near the $3.00 resistance level, causing the price to face rejection and react to the downside.
Currently, XRP trades near $2.90 and the 100-hourly Simple Moving Average. A connecting bullish trend line has formed with support at $2.85 on the hourly chart, providing a key technical level for traders to monitor.
The cryptocurrency market has received fresh institutional interest through the recently launched REX-Osprey XRPR ETF. According to the fund’s website, the XRPR ETF now holds over $30 million in assets after just three trading days of operation.
The REX-Osprey XRP ETF $XRPR which launched JUST last week already has more than $25 Million of Assets Under Management pic.twitter.com/x6aboTik7T
— ETF Tracker (@TheETFTracker) September 22, 2025
The fund carries an expense ratio of 0.75%, meaning a $100,000 investment costs approximately $750 annually in fees. This compares to BlackRock’s IBIT ETF, which maintains a 0.25% expense ratio.
The XRPR ETF’s early success signals strong demand from American institutional investors. Market analysts view this performance as a positive indicator for potential approval of seven additional XRP ETF applications filed by major firms including Grayscale and Fidelity.
Based on current XRPR performance, analysts estimate these future funds could attract between $8 billion and $10 billion in inflows during their first 12 months if approved. Such inflows would represent new money entering the XRP ecosystem rather than existing cryptocurrency being transferred between platforms.
The ETF development occurs as Donald Trump pushes for retirement accounts like 401k plans to gain crypto investment capabilities. While Bitcoin would likely receive the majority of these flows, analysts expect top-tier cryptocurrencies like XRP and Ethereum to benefit from residual investment.
Federal Reserve interest rate cuts provide another favorable backdrop for cryptocurrency investments. Historical data shows risky assets including crypto and stocks tend to perform well in low-interest-rate environments.
Daily chart analysis reveals XRP has declined since July due to reduced demand and profit-taking activity. This pullback brought the cryptocurrency to a strong pivot and reversal point according to Murrey Math Lines analysis.
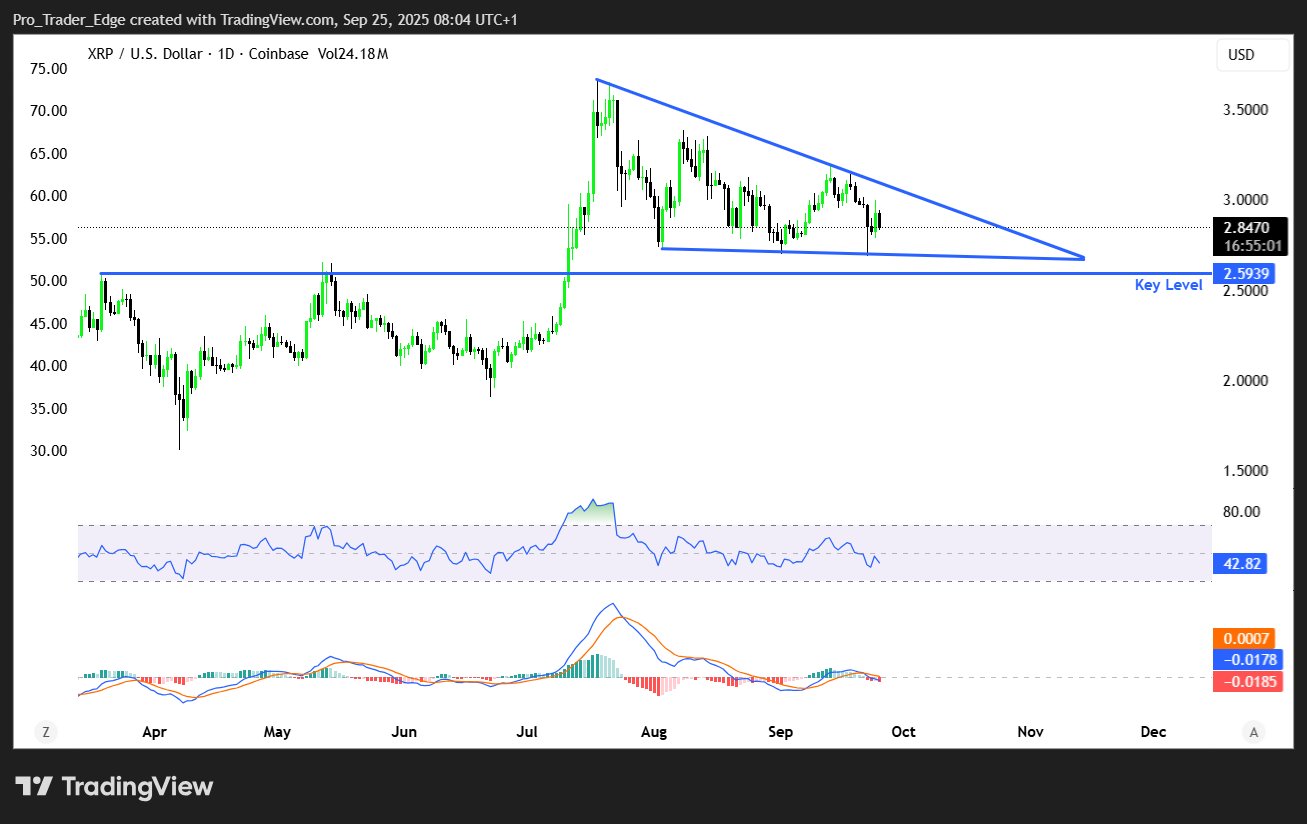
XRP has formed a downsloping channel with upper and lower boundaries connecting the highest and lowest levels since July. This channel formation contributes to what analysts identify as a bullish flag pattern.
Despite recent weakness, XRP has maintained its position above the 200-day moving average. The cryptocurrency has also developed a cup-and-handle pattern, which typically indicates potential upside movement.
On shorter timeframes, immediate resistance appears near the $2.96 level and the 61.8% Fibonacci retracement level. A clear break above $2.96 resistance could send XRP toward the $3.00 resistance zone, with further gains potentially targeting $3.05 and $3.12.
Conversely, failure to clear the $2.96 resistance could result in continued downward movement. Initial downside support sits near $2.88, followed by major support at $2.85 and the connecting trend line.
A break below the $2.85 support level could trigger further declines toward $2.78, with the next major support zone located near $2.70.
Technical indicators present a mixed picture for XRP’s near-term direction. The hourly MACD is gaining pace in bearish territory, while the RSI has dropped below the 50 level, suggesting weakening momentum.
Market participants continue monitoring whether bulls can overcome current resistance levels or if bears will push prices toward lower support zones.
The post XRP Price: Can Bulls Break Through $3 Resistance as New ETF Accumulates $30 Million appeared first on CoinCentral.


