XRP slipped 1.38% to $1.3592 on September 1, pulling back from August’s recovery as rising US Treasury yields pushed investors away from riskier assets.
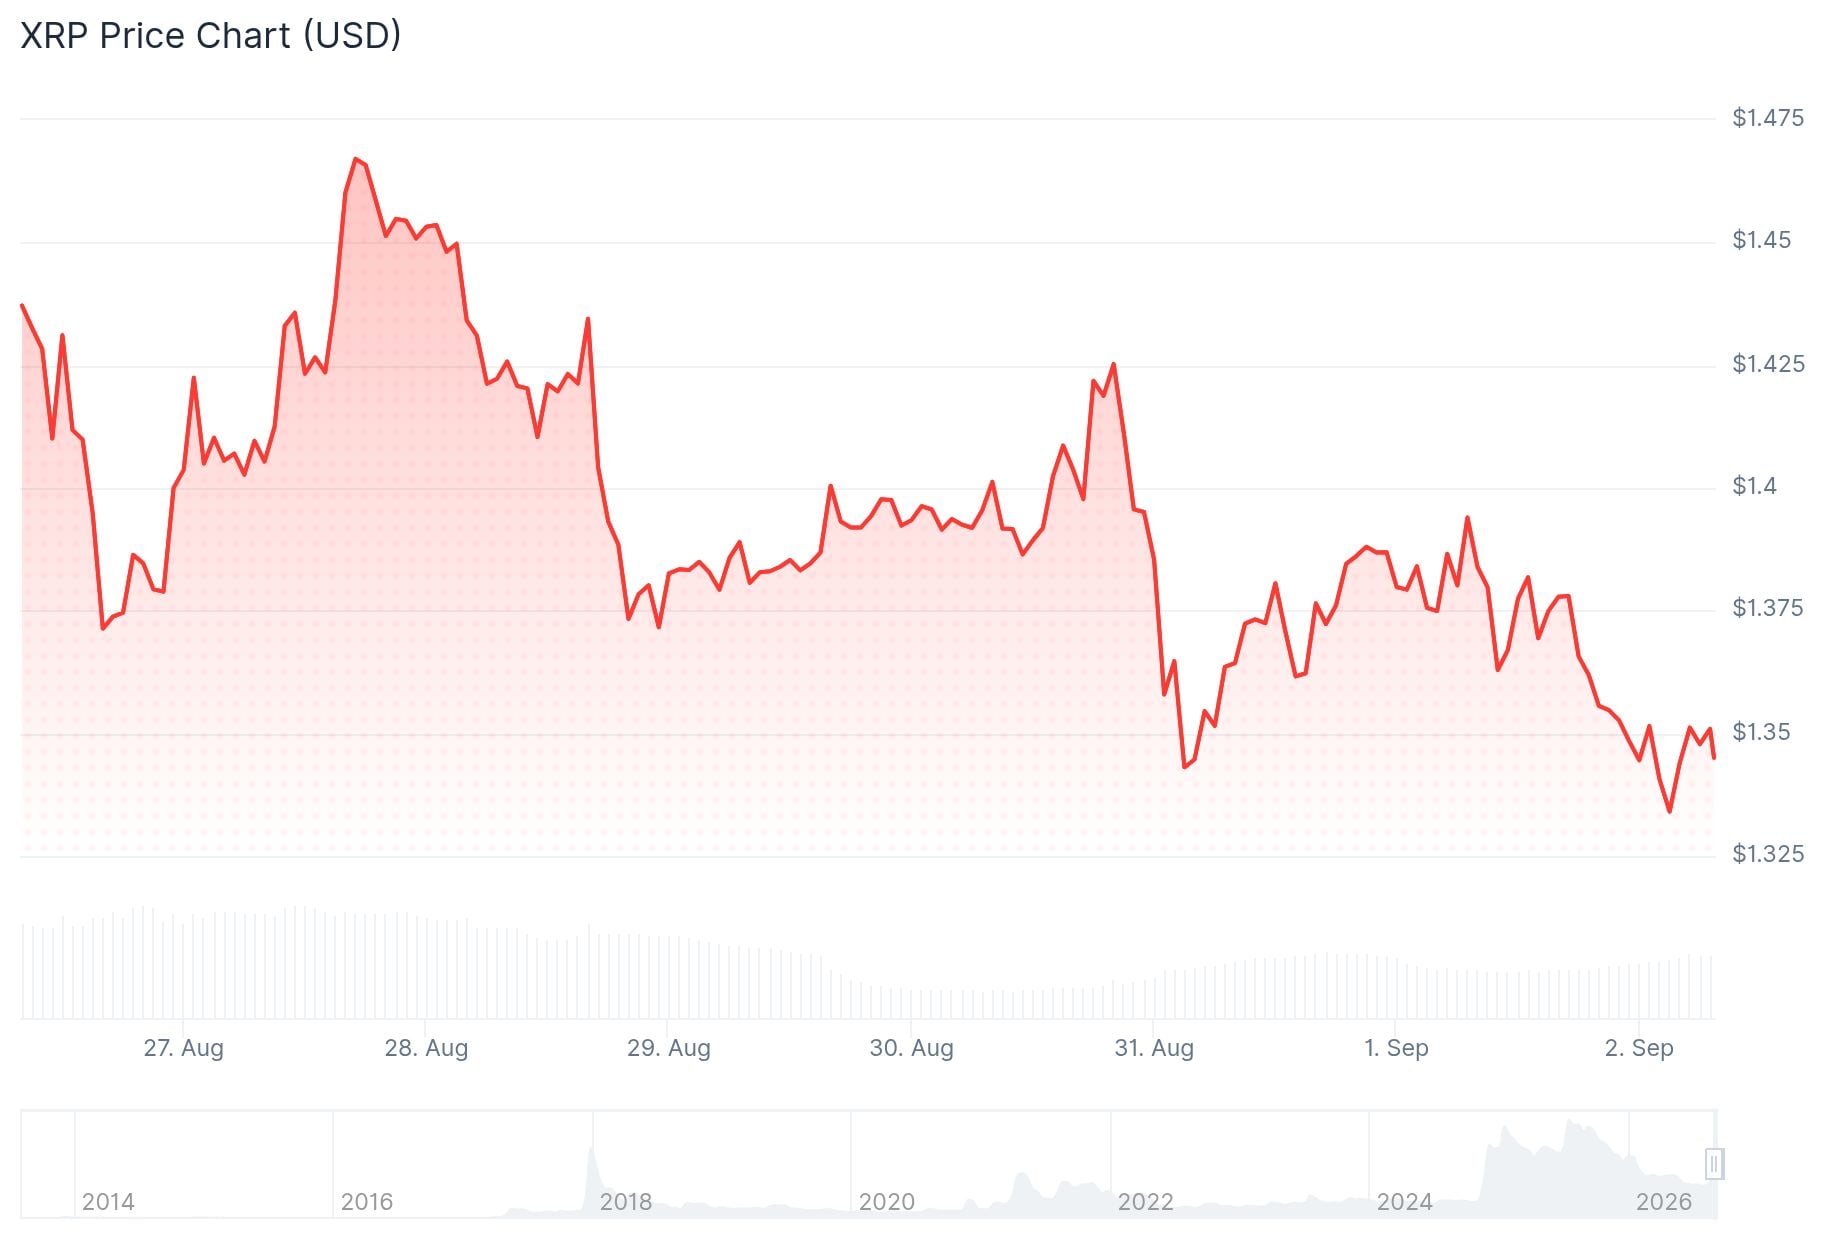
The token had briefly touched $1.69 during August before cooling off. It has since been trading in a tight range between $1.35 and $1.40.
Despite the price dip, demand through US spot XRP ETFs remained strong. The week ending August 28 saw net inflows of $110.49 million — the highest weekly figure of 2026 so far.
On August 31 alone, daily inflows came in at $5.64 million. Canary’s XRPC led with $4.71 million, and Bitwise added around $930,000.
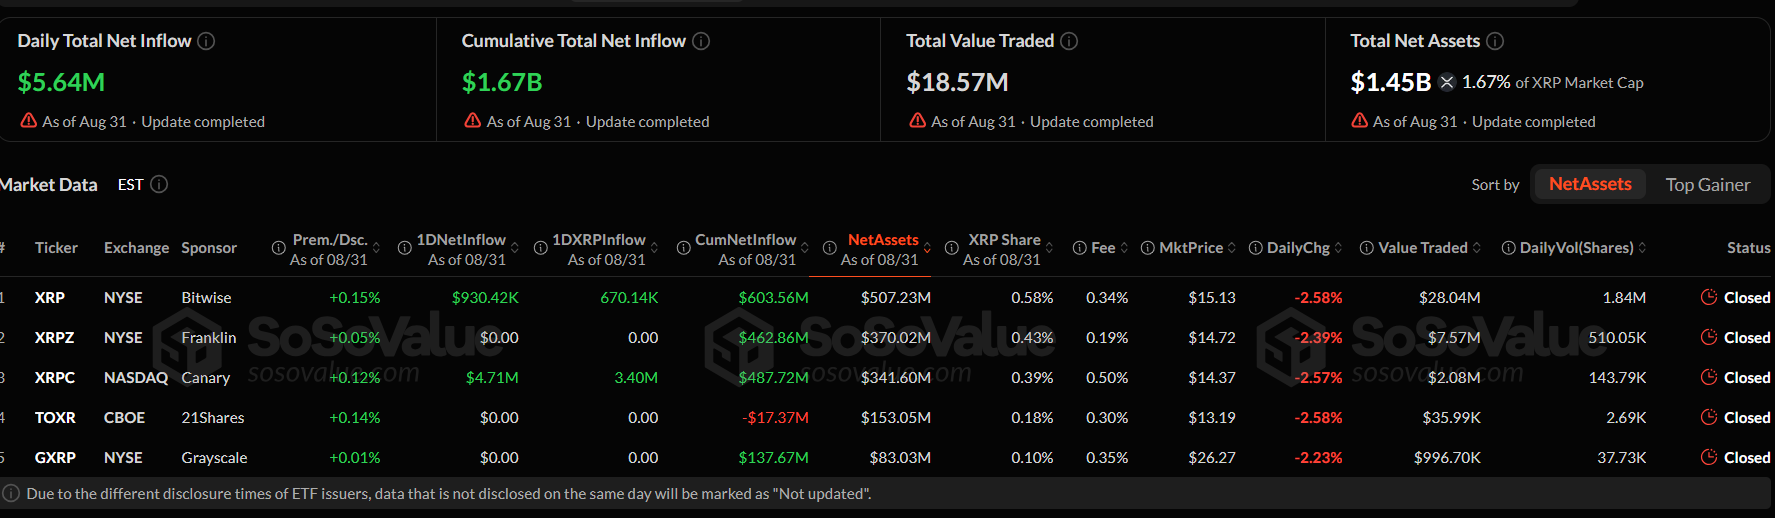
Total ETF assets reached $1.45 billion, equal to about 1.67% of XRP’s roughly $85 billion market cap. Bitwise led all funds with $507.23 million in total assets, followed by Franklin at $370.02 million and Canary at $341.60 million.
The 10-year Treasury yield climbed toward 4.80%, its highest point since January 2025. When government bonds offer higher returns, investors tend to move money out of crypto.
Crypto analyst XRP Update posted on X that XRP is “running out of room,” noting the 4-hour chart is squeezing between support near $1.35 and descending resistance around $1.40. The analyst said a clean break from this structure could trigger the next major move.
$XRP IS RUNNING OUT OF ROOM.
The 4H chart is squeezing between support near $1.35 and descending resistance around $1.40.
A clean break from this structure could trigger the next major move. 💥📈@Bird_XRPL ℹ️ pic.twitter.com/36jDOewOJd
— XRP Update (@XrpUdate) September 2, 2026
The RSI stood at 39.56, below neutral but not yet in oversold territory. The MACD line was at -0.0088, just above its signal line near -0.0090.
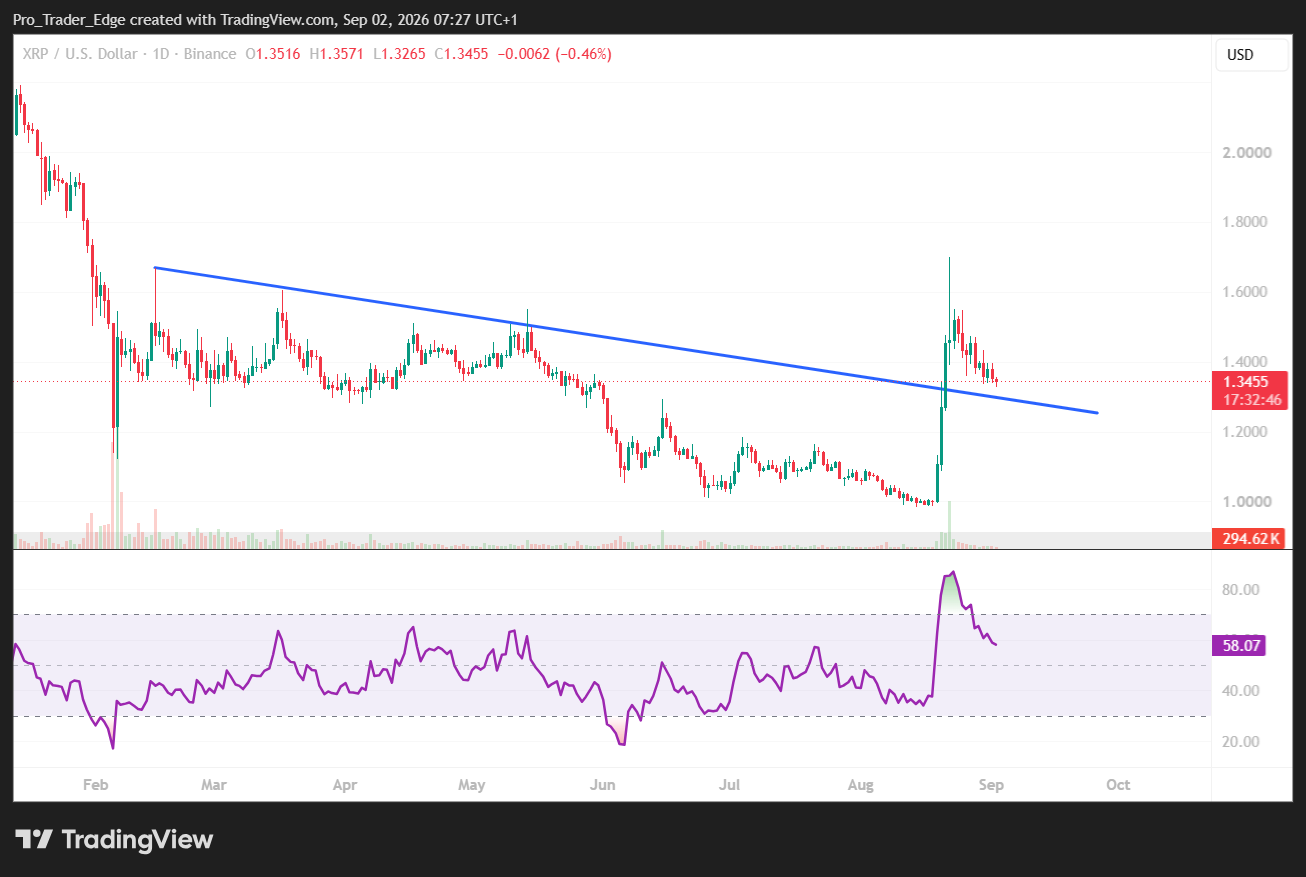
A close below $1.34 could open the way to $1.30. If selling pressure increases, $1.20 becomes the next level to watch.
On the upside, reclaiming $1.38 could point XRP back toward $1.50, with $1.60 as a further target.
TradingView contributor Kap_Waves identified a potential Wave 2 correction forming, with a projected pullback toward $1.15–$1.25 before any larger move. The analysis places Wave 3 targets at $2.90 and $3.10, though this is a technical scenario and not a confirmed path.
Senator Kevin Cramer said the CLARITY Act has a strong chance of advancing in the September 15 Senate vote. Kalshi traders assigned a 91% probability to a Senate vote before October, while Polymarket put the odds of the bill becoming law in 2026 at just 13%.
The SEC also proposed rules supporting blockchain use within securities transactions, a development that could signal regulatory progress even as Congress continues debating crypto legislation.
XRP was trading at $1.39 as of the latest data available.
The post XRP Price: Record ETF Inflows Can’t Stop the Slide — Watch These Levels appeared first on CoinCentral.





