
Today, the dollar index rose above last week’s peak around the 99.68 level, setting a new high for 2026. This movement is supported by a tense fundamental backdrop:
→ Inflationary pressures from rising oil prices. Markets may be pricing in a “higher for longer” scenario, with elevated Fed rates persisting.
→ Safe-haven demand. Escalation in the Middle East—including strikes on Iran and the rise of hardline leader Mojtaba Khamenei in Tehran—may push market participants towards defensive strategies and the US dollar.
→ Weakness in other currencies. The Middle East conflict can weigh on the yen and euro, as European and Japanese economies remain highly sensitive to energy prices.
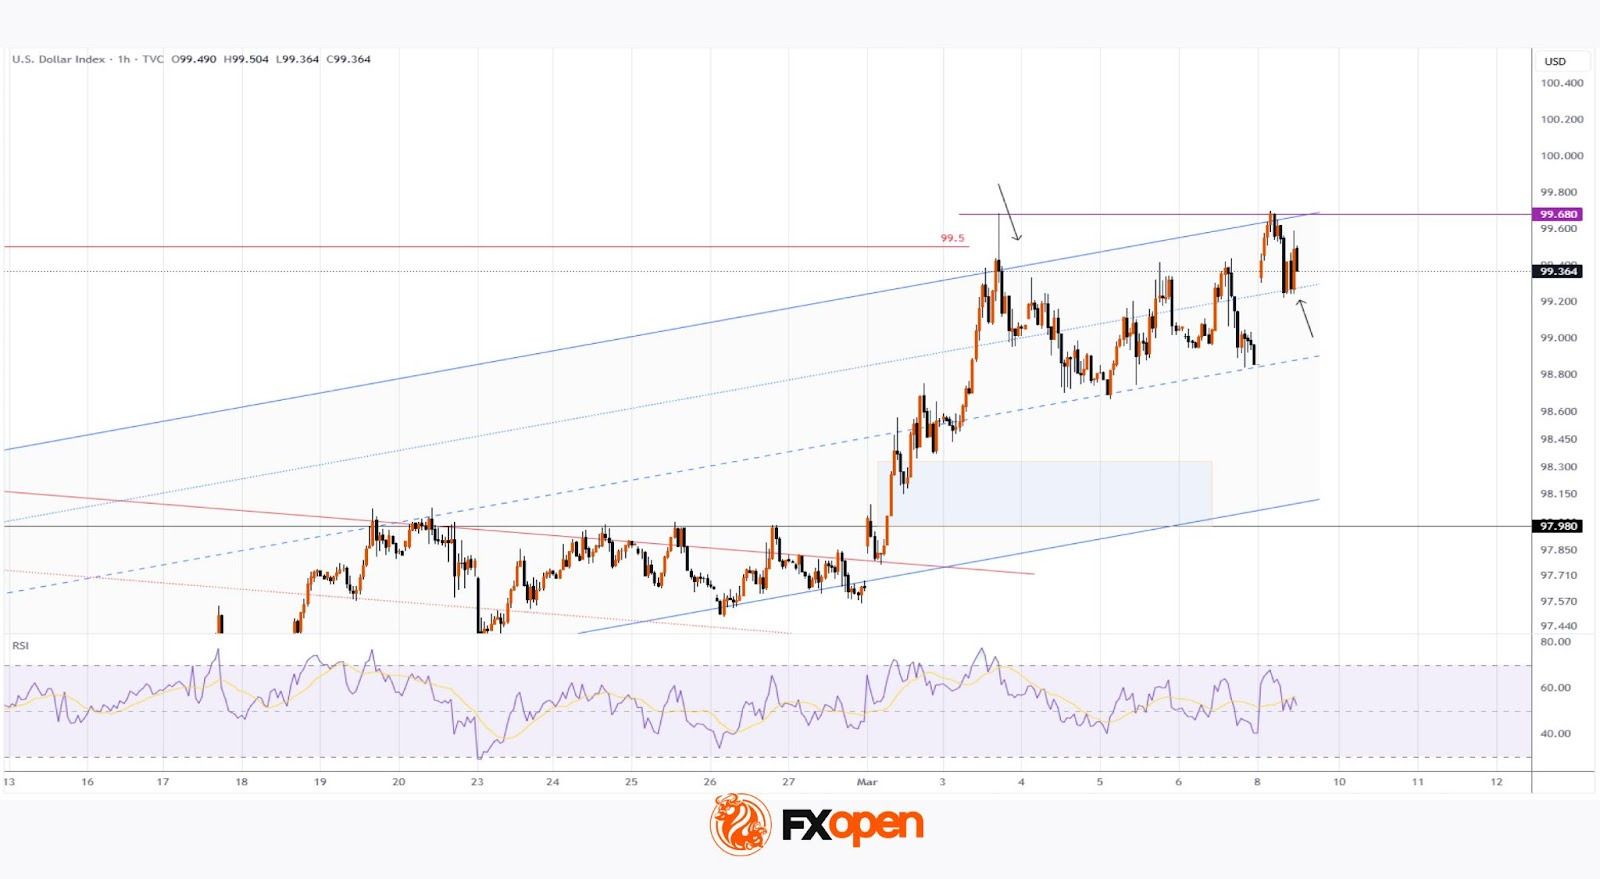
On the morning of 3 March, analysing the DXY chart, we:
→ drew an ascending channel (highlighted in blue);
→ anticipated that military escalation could drive the DXY index to the upper boundary of the channel.
Indeed, on the same day, the dollar index surged:
→ breaking above the channel’s upper boundary;
→ the RSI indicator entered overbought territory;
→ price slightly exceeded the January peak, signalling a possible bull trap.
As indicated by the first arrow, a long upper wick formed at the peak on 3 March, showing seller activity around the 99.60 level. Today’s brief surpassing of last week’s peak confirms this thesis, resembling a Liquidity Grab pattern.
On the other hand, buyers:
→ demonstrated strength at the market open (the bullish gap may continue to act as support);
→ can rely on support from the line dividing the upper half of the channel into two quarters (shown by the second arrow).
Traders should therefore be prepared for a scenario where DXY fluctuations show signs of stabilising near the yearly highs. Key developments around Iran are likely to have the strongest influence on the evolving balance.

