
Today’s XAU/USD chart shows that gold continues to set records in September. The price has risen above $3,650 per ounce for the first time in history – one of the main drivers being expectations of a Federal Reserve rate cut on Wednesday, 17 September.
Easier monetary policy is generally seen as boosting gold’s appeal – this has pushed XAU/USD nearly 6% higher since the start of September. However, the chart highlights three reasons why further upside may be limited.
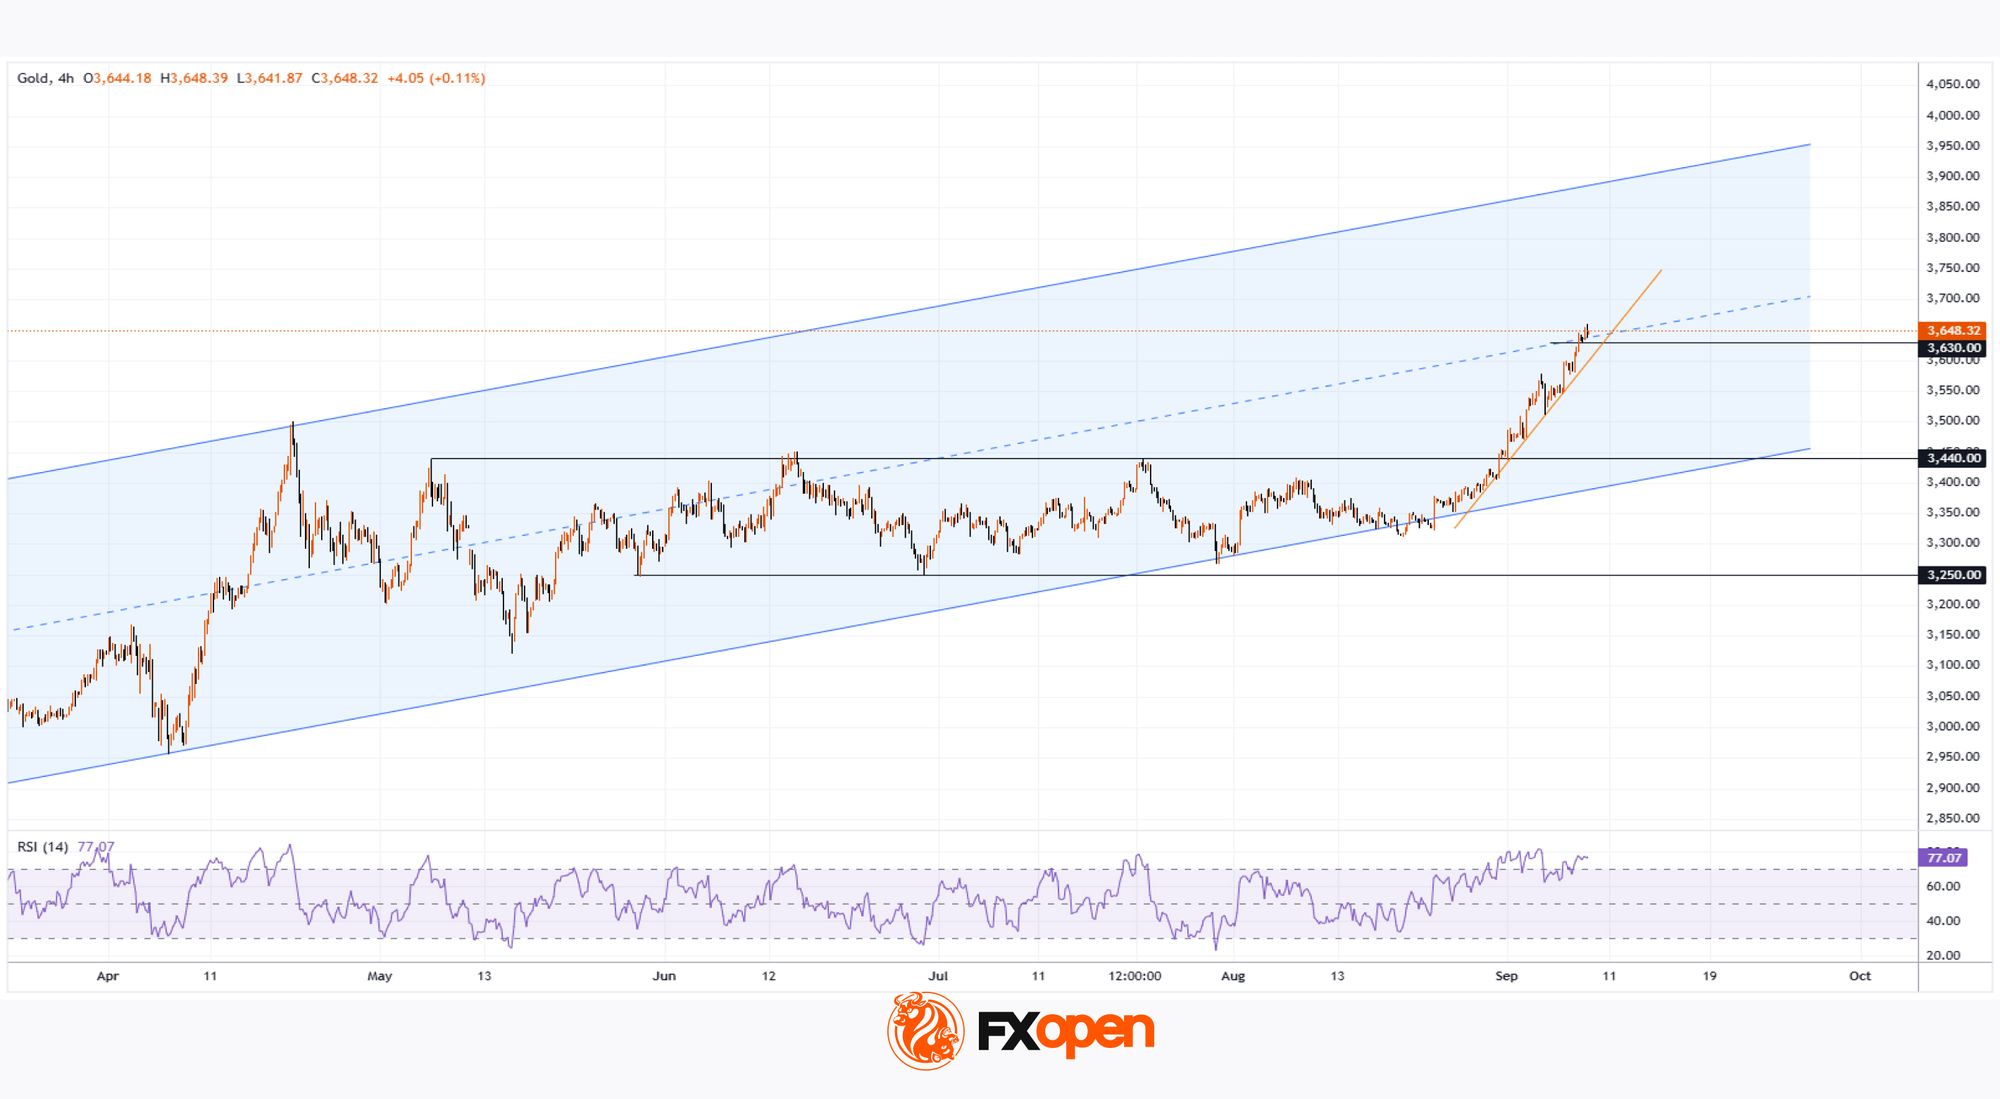
Technical Analysis of the XAU/USD Chart
1. Long-term channel:
Over the course of 2025, gold price movements have formed an ascending channel (shown in blue), and today XAU/USD is trading close to its median line. This is where supply and demand typically balance out. Buyers may consider the post-September rally overstretched, while sellers could view the all-time high as an opportunity to take profits.
2. Rectangle pattern target reached:
The range between $3,250 and $3,440 that developed mid-year can be interpreted as a rectangle pattern. Following the bullish breakout, the implied target of $3,630 has already been achieved.
3. RSI signals risk:
The RSI indicator is close to forming a bearish divergence.
Given the steep angle of the orange support line, a correction – for example, towards the psychological level of $3,550 – might occur.
In summary, gold’s upward momentum may start to slow. At the same time, given the market’s inertia, traders may have little reason to expect a decisive shift away from bullish dominance. Still, next Wednesday could bring surprises.
For expert projections, see the article: Analytical Gold Price Forecasts for 2025, 2026, 2027, and Beyond.


