
Toncoin (TON) is moving in a bearish-to-neutral trajectory, as BTC has crossed the $71K level and continued its upward journey, which impacts the overall market, including altcoins like TON. The TON price has shown stability over the last 24 hours, but over the last week it has surged by 9.53%.
According to CoinMarketCap, TON is currently trading at $1.35, supported by a trading volume of $74.04 million, which has surged by 7.28% over the last 24 hours. Furthermore, its market capitalization stands at $3.31 billion, which is stable.
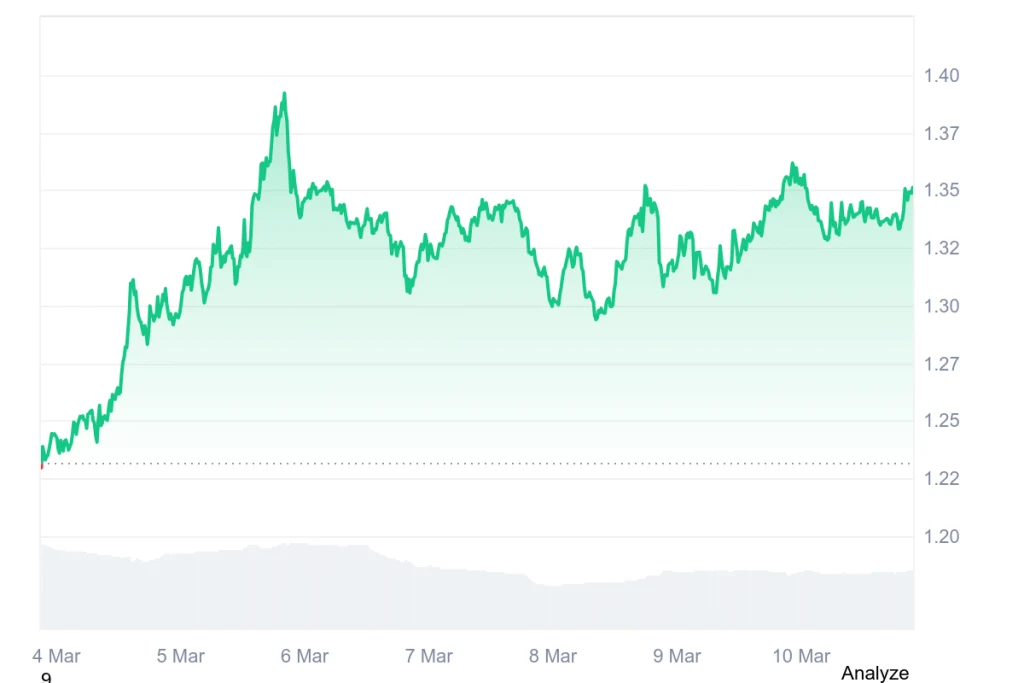
Source: CoinMarketCap
Also Read: Toncoin (TON) Eyes Powerful 29% Jump Despite Bearish Signals
Toncoin (TON) is currently undergoing a crucial retest phase after breaking out of a falling wedge pattern on the daily chart.
According to the crypto analyst Jonathan Carter, the token is now revisiting the former resistance line, which is beginning to act as a support zone. This validation process is important for confirming the strength of the recent breakout.

Source: Jonathan Carter’s X Post
However, if the support holds up during the retest, the overall bullish setup for TON could still be intact. Jonathan Carter believes that the technical setup still looks quite healthy and is therefore expected to move higher.
If the price picks up momentum, there are several resistance levels that experts will be looking at, including $1.45, $1.90, $2.36, and finally $2.83.
According to TradingView, the RSI is at 51.35, making its way to the neutral area after a gradual increase since February’s low prices. Its movement above the 42.03 signal line is a clear indicator that the bearish momentum is losing ground.
This trend shows that buyers are getting more confident, yet it is not in the overbought region, giving room for the current price increase to continue to higher resistance levels.

Source: TradingView
From the MACD indicator, there is a clear bullish crossover since the blue line is above the orange line.
Although the two lines are still below the zero line, the change to green indicates a trend reversal is taking place since the distance between the two lines is increasing. This indicates that the buying pressure is increasing.
Also Read: Toncoin (TON) Stabilizes at Key Support, Eyeing $1.95 as Potential Upside Target


