
Traders are always on the lookout for reliable analysis tools that can help them make informed trading decisions. One such tool is the triple top trading pattern. It is a bearish reversal formation that can help traders identify potential trend reversals and take advantage of market opportunities.
In this FXOpen article, we will explore what the triple top pattern is, what it indicates, and how to identify it on price charts. Keep reading to find examples that will help you understand how to use it in a trading strategy.
A triple top is a technical analysis pattern that signals a potential reversal in a trend. Is the triple top bullish or bearish? It’s a bearish formation. The pattern occurs when the price of an asset hits the same resistance level three times, failing to break above it on each occasion. This indicates that buyers are losing strength and sellers are starting to dominate the market. It is often seen after a sustained uptrend.
Identifying a triple top involves spotting three distinct peaks at roughly the same price level, separated by two troughs. The peaks are formed when the price hits resistance but fails to push through, while the troughs occur when the price retraces after each failed attempt.
To confirm a valid triple top, the peaks should be close in height, and the troughs should create a roughly horizontal neckline. The pattern is confirmed when the price breaks below the neckline, signalling that sellers have overtaken buyers.

Once traders have identified the triple top formation, they can use various trading strategies to take advantage of it. However, there are common rules that are used as the basis:
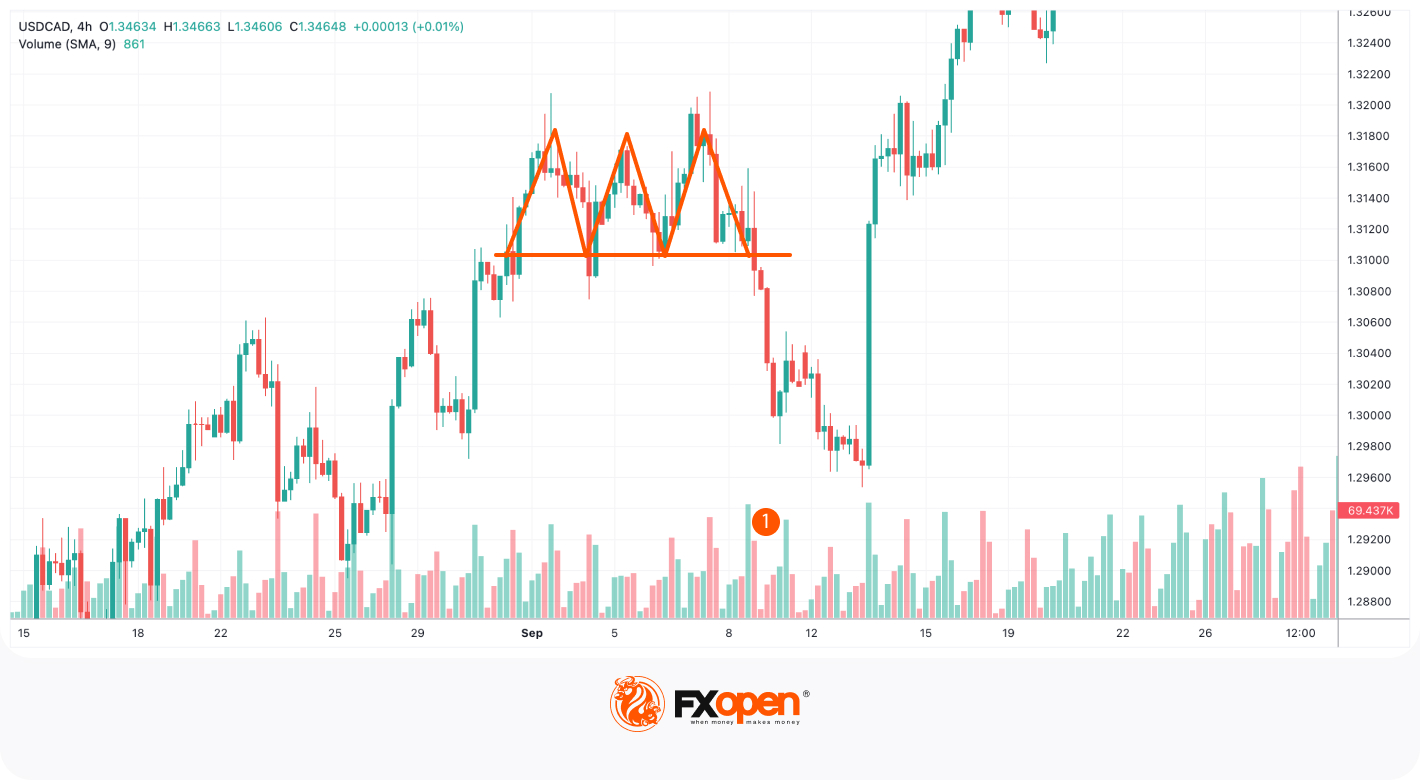
In the chart above, the price formed the triple top. We could have entered a short position once the price broke below the neckline and closed it either at the point equal to the distance between the peaks and the neckline or at the closest support level, as the levels are almost equal. However, selling volumes were low (1) at the breakout level, so we could have expected an upcoming bullish reversal. Therefore, we wouldn’t have kept the position beyond the initial take-profit target.
To confirm the triple top pattern and ensure its validity, traders use a combination of technical tools and indicators. These help confirm that the trend is indeed reversing and not just experiencing a temporary pullback. Here are the key methods traders use:
However, this isn’t a comprehensive list; you can test different indicators on the TickTrader platform for free to determine the one that will validate the triple top formation.
It is important to distinguish between the triple top and the triple bottom chart patterns, as the former is the bearish setup, while the latter is a bullish reversal formation. The triple bottom setup forms when the price hits a particular support level three times and fails to break through it. It suggests that the sellers have lost their strength, and the buyers are starting to take control. The bottoms are separated by two peaks, which occur when the price retraces some of its gains from the support level.

Traders use the same principles to trade the triple bottom as they would the triple top but vice versa. They enter a long position when the price breaks above the neckline and set a stop-loss order below it. The take-profit target might equal the distance between bottoms and peaks or be set at the closest resistance level.
While the triple top pattern is a valuable tool for spotting reversals, it has its limitations. Traders should be aware of the following challenges:
The triple top pattern offers traders a powerful tool for identifying potential market reversals. However, it’s crucial to confirm the pattern and integrate it with other forms of analysis to avoid false signals. Ready to put these insights into action? Open an FXOpen account today, and trade with a broker offering tight spreads, low commissions, and advanced trading platforms.
The triple top pattern meaning refers to a bearish reversal formation indicating a potential end to an uptrend. It forms when the price reaches the same resistance level three times without breaking through, suggesting weakening buying momentum and increasing selling pressure. This pattern signals that the asset's price may soon decline.
To confirm a triple top pattern, traders watch for a decisive break below the neckline, which connects the lows between the peaks. Increased trading volume during the breakout strengthens the confirmation, indicating strong seller interest. Technical indicators like the Stochastic Oscillator showing bearish divergence can provide additional validation.
No, a triple top is not bullish; it is a bearish reversal pattern. It signifies that the asset's price has repeatedly failed to surpass a resistance level, indicating diminishing upward momentum. Traders see this as a cue to consider short positions or to exit existing long positions.
A triple top is generally considered stronger than a double top pattern because the price has failed to break resistance three times instead of two. This extra failed attempt reinforces the strength of the resistance level and increases the likelihood of a significant reversal. However, both patterns are important and should be analysed with other market factors.


